Linear Attribution for E-commerce
Learn what linear attribution is, how it splits credit equally, why Google removed it, and how order-based attribution gives you accurate multi-touch data.

Tilen Ledic
Written by
Your marketing team runs five channels. Google Ads brings in new visitors. Organic search picks up branded queries. Facebook retargeting nudges people back. Email sends them a discount code. And some customers just type your URL directly. At the end of the month, you have 200 orders. The question: which channels deserve credit?
One model says the answer is simple. Split the credit equally. If a customer touched four channels before buying, each channel gets 25%. No favorites. No bias. No arguments about which team's channel is "really" driving revenue.
That model is linear attribution. It sounds fair. It is easy to understand. And in September 2023, Google removed it from both Google Ads and GA4, along with first-click, time-decay, and position-based models. Fewer than 3% of conversion actions were using it.
But the question linear attribution tried to answer (how do you give every touchpoint a fair share of the credit?) is still one of the most important questions in e-commerce marketing. Understanding how this model works, where it breaks, and what has replaced it will help you evaluate any attribution approach, whether you build your own or use a platform.
What Is Linear Attribution?
Linear attribution is a multi-touch attribution model that distributes conversion credit equally across every touchpoint in the customer journey. If a customer interacted with your brand five times before purchasing, each interaction receives exactly 20% of the credit, regardless of what that interaction was or when it happened.
The logic behind it: every marketing interaction played a role in moving the customer toward purchase. The first ad introduced the brand. The organic visit built trust. The retargeting ad reminded them. The email provided an incentive. The direct visit closed the deal. Removing any single touchpoint might have broken the chain. Since you cannot prove which touchpoint mattered most, treat them all equally.
In marketing attribution terminology, "linear attribution" is sometimes called "equal-weight attribution" or "even-credit attribution." All refer to the same model: divide 100% of the credit by the number of touchpoints.
How Linear Attribution Calculates Credit (With Example)
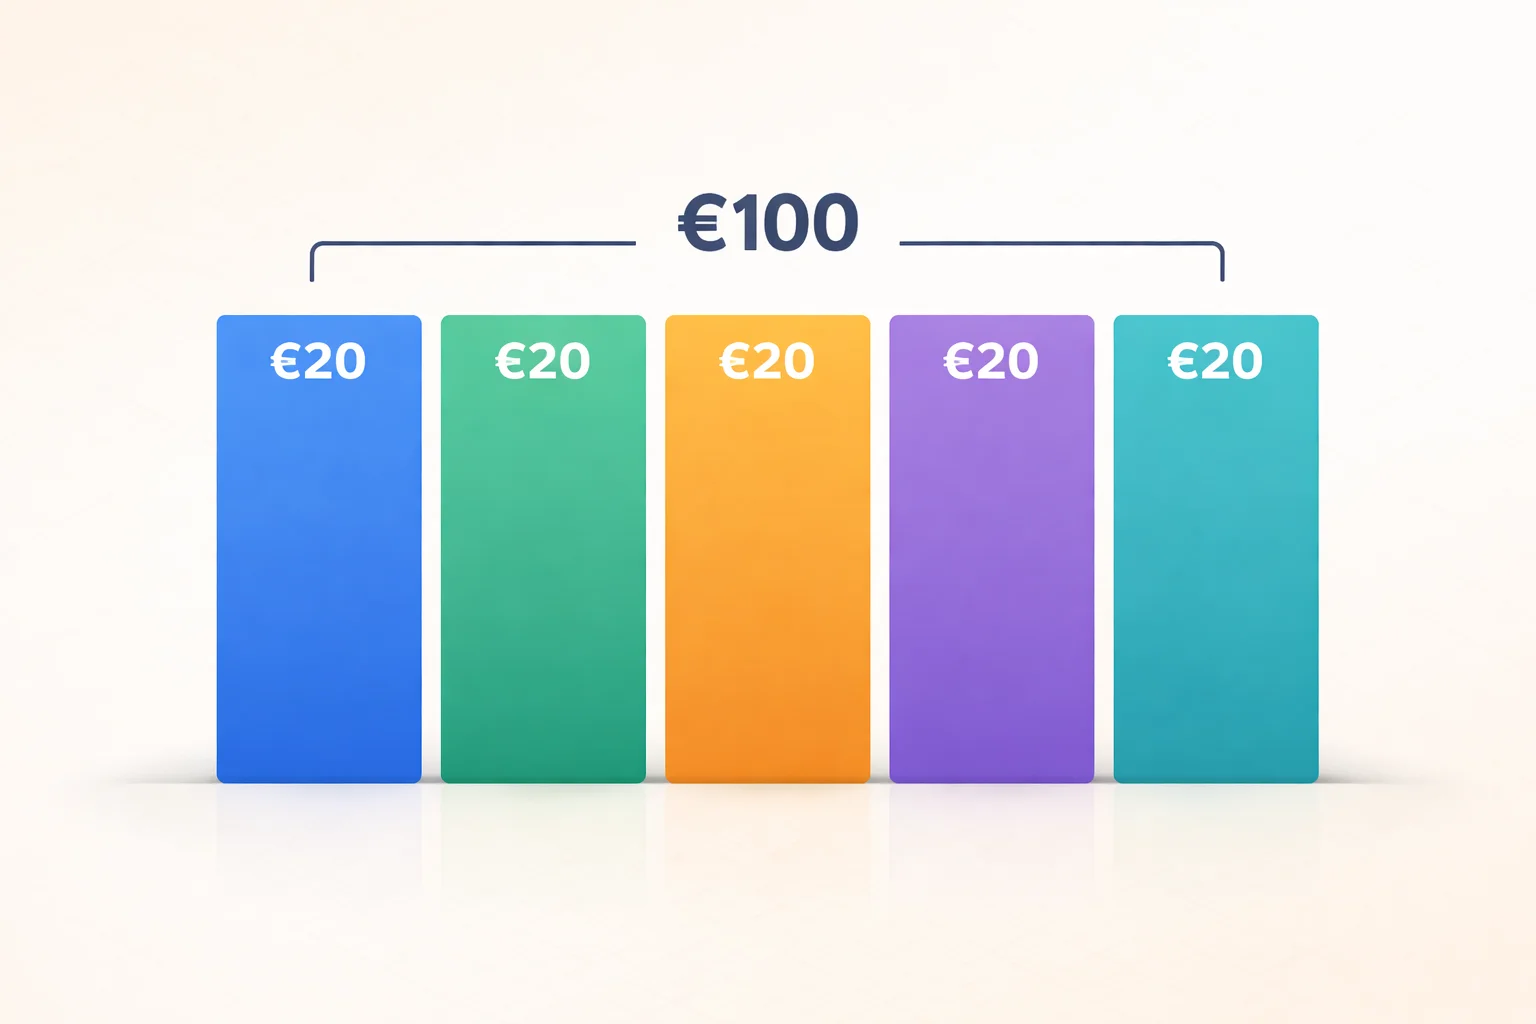
Here is a practical example. A customer discovers your store through these touchpoints before placing a €100 order:
- Clicks a Google Ad (Day 1)
- Visits from organic search (Day 5)
- Clicks a Facebook ad (Day 8)
- Opens an email (Day 12)
- Visits directly and purchases (Day 14)
Under linear attribution, every touchpoint receives an equal share. Five touchpoints means each one gets exactly €20:
| Attribution model | Google Ads | Organic | Direct | ||
|---|---|---|---|---|---|
| First-touch | €100 | €0 | €0 | €0 | €0 |
| Last-touch | €0 | €0 | €0 | €0 | €100 |
| Linear | €20 | €20 | €20 | €20 | €20 |
| Multi-touch (U-shaped) | €40 | €7 | €7 | €7 | €40 |
The calculation is straightforward: €100 / 5 touchpoints = €20 per touchpoint. If the customer had touched only three channels, each would receive €33.33. If seven channels, €14.29 each.
This is the core appeal. No channel gets overvalued. No channel gets ignored. The formula is transparent and repeatable.
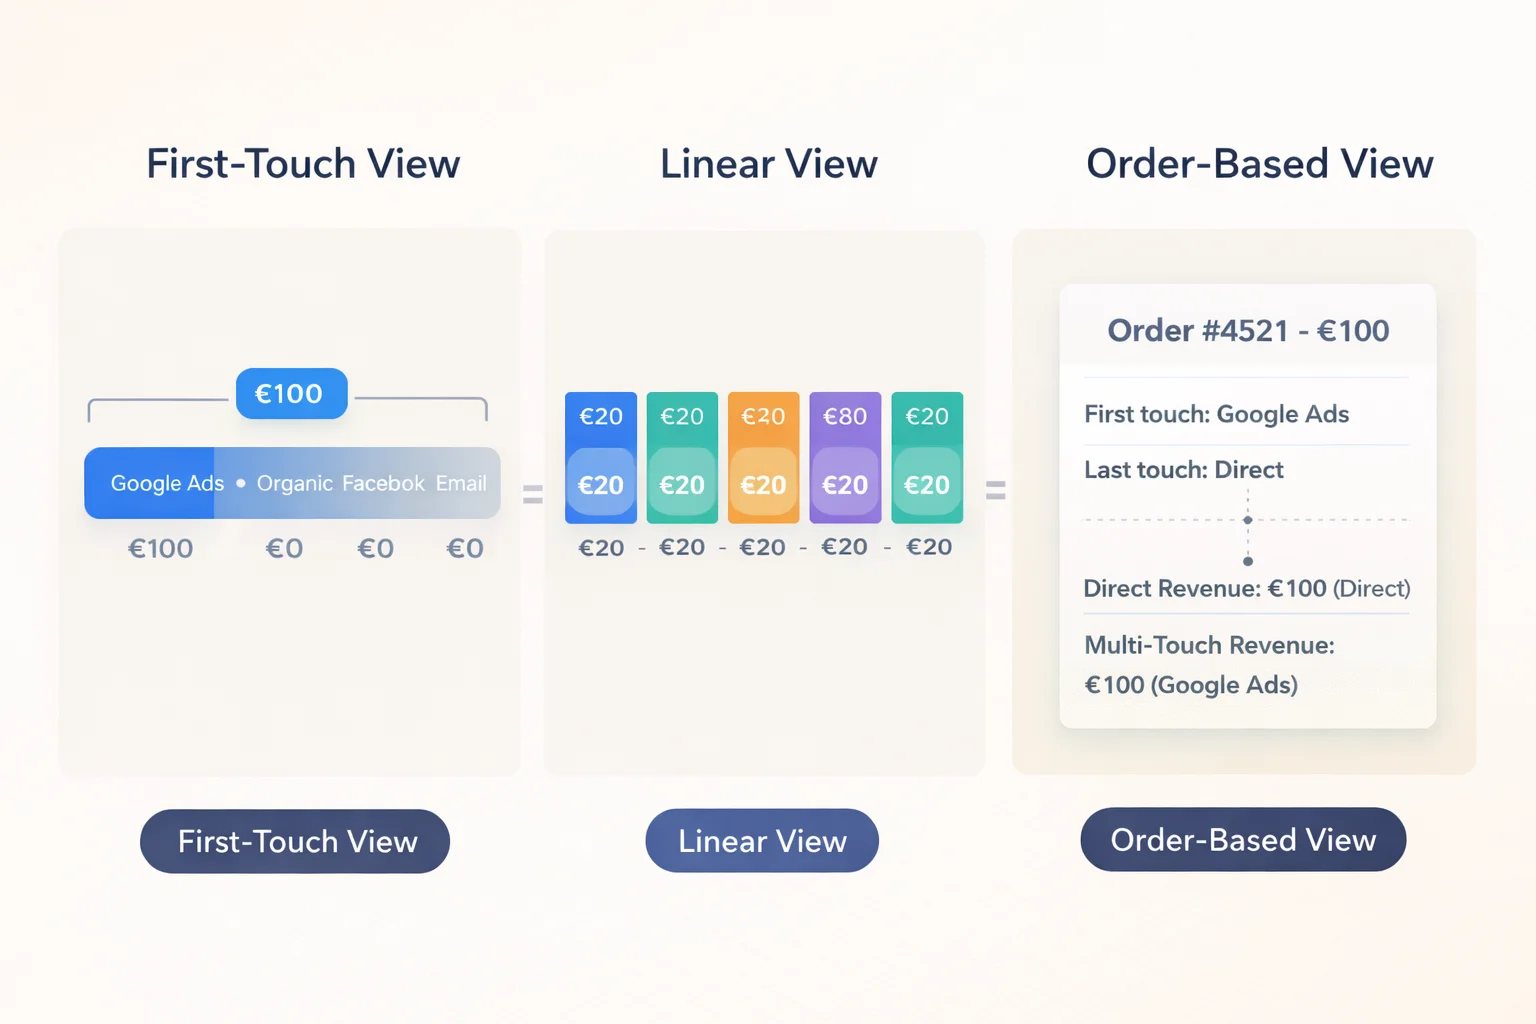
Compare this with the extremes. First-touch attribution gives Google Ads all €100 and says the other four channels contributed nothing. Last-touch attribution does the opposite, crediting only the Direct visit. Both are wrong. Both are useful for different questions. Linear attribution avoids picking a winner, but at the cost of pretending there is no winner at all.
Linear Attribution in Google Analytics 4 and Google Ads
If you are looking for linear attribution in GA4 or Google Ads today, you will not find it. Google removed linear, first-click, time-decay, and position-based attribution models in September 2023. Only two options remain:
- Data-driven attribution (DDA): Google's machine learning model that assigns credit based on observed conversion patterns across your account. This is now the default.
- Paid and organic last click: The traditional last-click model that assigns all credit to the final click.
Why Google removed linear attribution
Google stated that rules-based models like linear "don't provide the flexibility needed to adapt to evolving consumer journeys". The practical reason: fewer than 3% of conversion actions in Google Ads used these models. Most advertisers had already migrated to data-driven attribution or never moved away from last-click.
The deeper issue is that Google's data-driven attribution is a black box. You cannot see the exact weights it assigns to each touchpoint. With linear attribution, the math was transparent: divide by the number of touchpoints. With DDA, Google's algorithm makes that decision based on cross-account patterns, and individual advertisers cannot audit the logic.
What this means for your reporting
If you previously used linear attribution in Google Ads or GA4, your conversion actions were automatically switched to data-driven attribution. Your historical data under the linear model is preserved but no longer actively assigned.
For e-commerce stores that valued the transparency of equal-credit distribution, the options are now limited within Google's ecosystem. You either trust the DDA black box or fall back to last-click, which ignores every touchpoint except the final one.
Linear Attribution vs Other Models
How does linear attribution compare with other approaches? Here is how each model handles the same five-touchpoint customer journey:
| Aspect | Linear | First-touch | Last-touch | U-shaped | Time-decay | Data-driven |
|---|---|---|---|---|---|---|
| Credit to first touch | Equal share (20%) | 100% | 0% | 40% | Lowest | Varies (algorithm) |
| Credit to last touch | Equal share (20%) | 0% | 100% | 40% | Highest | Varies (algorithm) |
| Credit to middle touches | Equal share (20% each) | 0% each | 0% each | ~7% each | Moderate, increasing | Varies (algorithm) |
| Transparency | Full (simple division) | Full | Full | Full | Full | None (black box) |
| Available in GA4 (2026) | ✗ | ✗ | ✓ | ✗ | ✗ | ✓ |
| Best for | Balanced channel overview | Brand awareness valuation | Conversion optimization | Valuing first + last | Short purchase cycles | Large accounts with sufficient data |
The key distinction: linear attribution is the only model that gives identical credit to every touchpoint. This makes it the most "democratic" but also the least informative when you need to decide where to increase or cut budget.
When Does Linear Attribution Make Sense?
Even though Google deprecated it, the linear attribution concept still provides value in specific scenarios:
| Your situation | Why linear thinking helps | Practical approach |
|---|---|---|
| Long, complex customer journeys (B2B, high-ticket) | Many genuine touchpoints, hard to prove which one mattered most | Use linear as a baseline, then compare with DDA or U-shaped |
| Early-stage store with limited data | Not enough conversions for data-driven models to work accurately | Linear gives every channel fair representation while you gather data |
| Evaluating a new channel | You want to see if the new channel appears in customer journeys at all | Linear ensures mid-funnel touches are not hidden by first/last-touch bias |
| Internal budget discussions | Teams argue over which department's channel "really" drives revenue | Linear stops the argument. Combine with order-level data for deeper insight |
| Omnichannel awareness campaigns | Goal is balanced presence across channels, not optimizing one channel | Linear rewards consistency across touchpoints |
The common thread: linear attribution works best when you genuinely believe all touchpoints contribute roughly equally, or when you need a neutral starting point before applying a more sophisticated model.
Limitations of Linear Attribution
Linear attribution has fundamental weaknesses that explain why even Google stopped supporting it:
All touchpoints are not equal. A customer who clicks your Google Ad for the first time is having a fundamentally different experience than someone who opens your weekly newsletter for the tenth time. Linear attribution says both contributed equally. In reality, the first click may have created €80 of value while the email reminder added €5.
It dilutes high-performing channels. If Google Ads generates 60% of new customer introductions but gets the same 20% credit as a transactional email, your ROAS calculations will be skewed. You might underinvest in the channel that actually creates demand.
It inflates low-value touchpoints. Did a customer briefly land on your site from a social share, bounce in 3 seconds, and then convert two weeks later through a Google Ad? Linear attribution gives that accidental social visit the same credit as the ad that did the actual convincing.
No weighting by recency. A touchpoint from two weeks ago probably influenced the purchase less than one from yesterday. Time-decay models address this by giving recent touches more credit. Linear ignores timing completely.
It does not account for touchpoint quality. A 5-minute product page visit with add-to-cart activity is qualitatively different from a 2-second homepage bounce. Linear attribution counts both as one touchpoint.
Google no longer supports it natively. Since September 2023, you cannot select linear attribution in GA4 or Google Ads. Any implementation requires manual calculation in spreadsheets, data warehouses, or third-party tools. This added complexity removes much of the model's original appeal: simplicity.
Comparing All Attribution Models for E-commerce
If you are choosing an attribution approach for your store, here is how all major models stack up. For a deep dive into multi-touch approaches, see our complete guide to multi-touch attribution, or step back to the complete guide to ecommerce attribution for how the whole picture connects.
| Factor | First-touch | Last-touch | Linear | U-shaped | Time-decay | Data-driven |
|---|---|---|---|---|---|---|
| Answers the question | "What creates customers?" | "What closes sales?" | "Which channels appear in journeys?" | "What creates and closes?" | "What influenced recent decisions?" | Algorithmic best guess |
| Best for | Brand awareness budgets | Direct response optimization | Balanced channel evaluation | Full-funnel analysis | Short purchase cycles | Large accounts (1000+ conversions/month) |
| Setup complexity | Low | Low | Medium (manual since 2023) | Medium (manual since 2023) | Medium (manual since 2023) | Low (Google default) |
| Transparency | ✓ | ✓ | ✓ | ✓ | ✓ | ✗ |
| Available in GA4 | ✗ (via dimensions only) | ✓ | ✗ | ✗ | ✗ | ✓ |
| Risk of overspend | Awareness channels | Closing channels | Low-value mid-funnel | First + last channels | Recent channels | Unknown (black box) |
No single model gives you the complete picture. The practical approach is to compare what different models tell you about the same data and investigate the gaps.
How Enalitica Handles Attribution Without Picking a Model
The core problem with every model in the table above is the same: they start from analytics sessions and try to reconstruct what happened. If a session was blocked by an ad blocker, killed by Safari's ITP, or rejected by a cookie consent banner, that touchpoint disappears. The model never sees it.
Enalitica takes a fundamentally different approach. Instead of tracking sessions and hoping they lead to orders, it starts from confirmed orders in your WooCommerce or Shopify store and attributes backwards. Every order is a fact. No ad blocker, cookie consent banner, or browser restriction can make that order disappear.
First-touch and last-touch data per order
For every order that syncs into Enalitica, the GA4 enrichment layer retrieves:
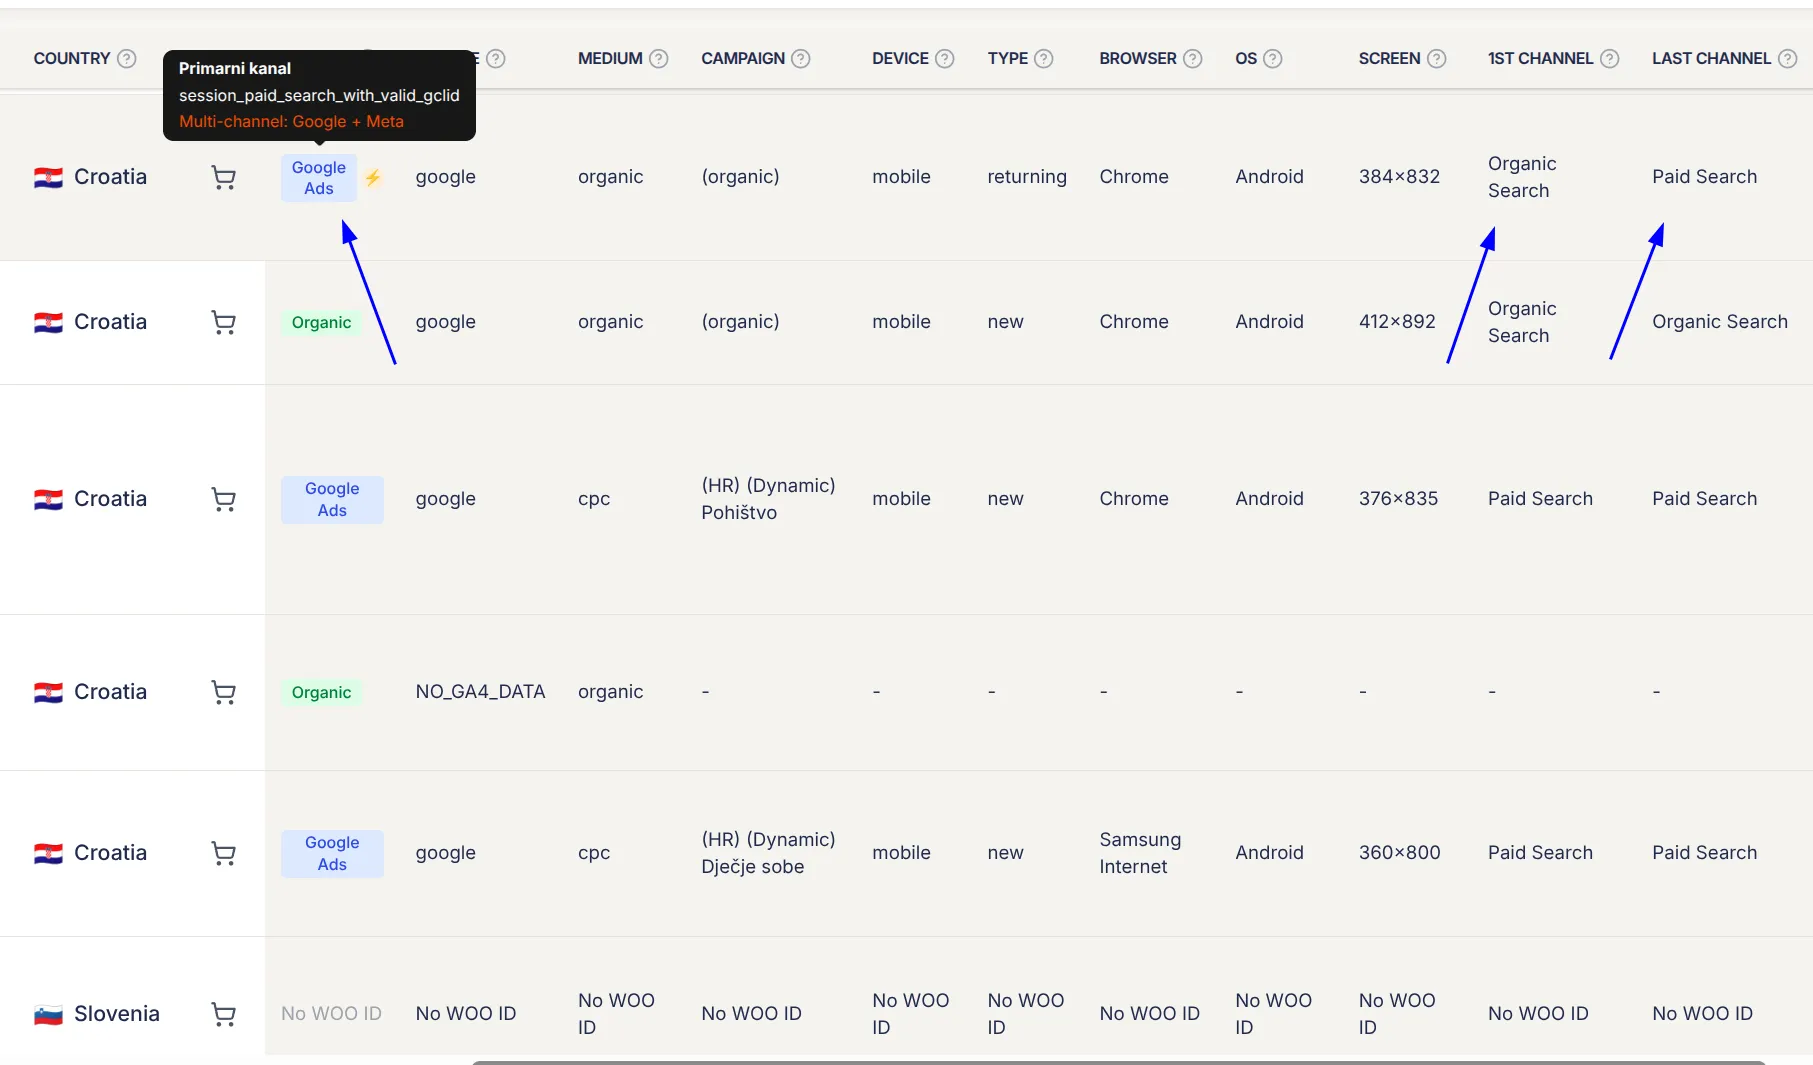
- First user channel group: How this customer first discovered your store (Paid Search, Organic Search, Social, Direct, etc.)
- Session channel group: The channel the customer used for the purchasing session (last touch)
- Click IDs: If the customer clicked a Google Ad or Meta Ad at any point, the GCLID or FBCLID is stored in the order metadata with the exact timestamp
Instead of applying a formula to divide credit (the way linear attribution does), you see both the actual first touch and the actual last touch for every single order. Not modeled. Not estimated. Actual data per actual order.
This is more useful than linear attribution because you can now ask: "For orders where Google Ads was the first touch but email closed the sale, what was the average order value?" That is a concrete business question. Linear attribution would have told you Google Ads gets 25% of the credit, but it would not have shown you that the customers Google Ads introduces spend 30% more than average.
Direct vs influenced revenue
The Porocila (Reports) tab shows every marketing channel with two revenue figures side by side:
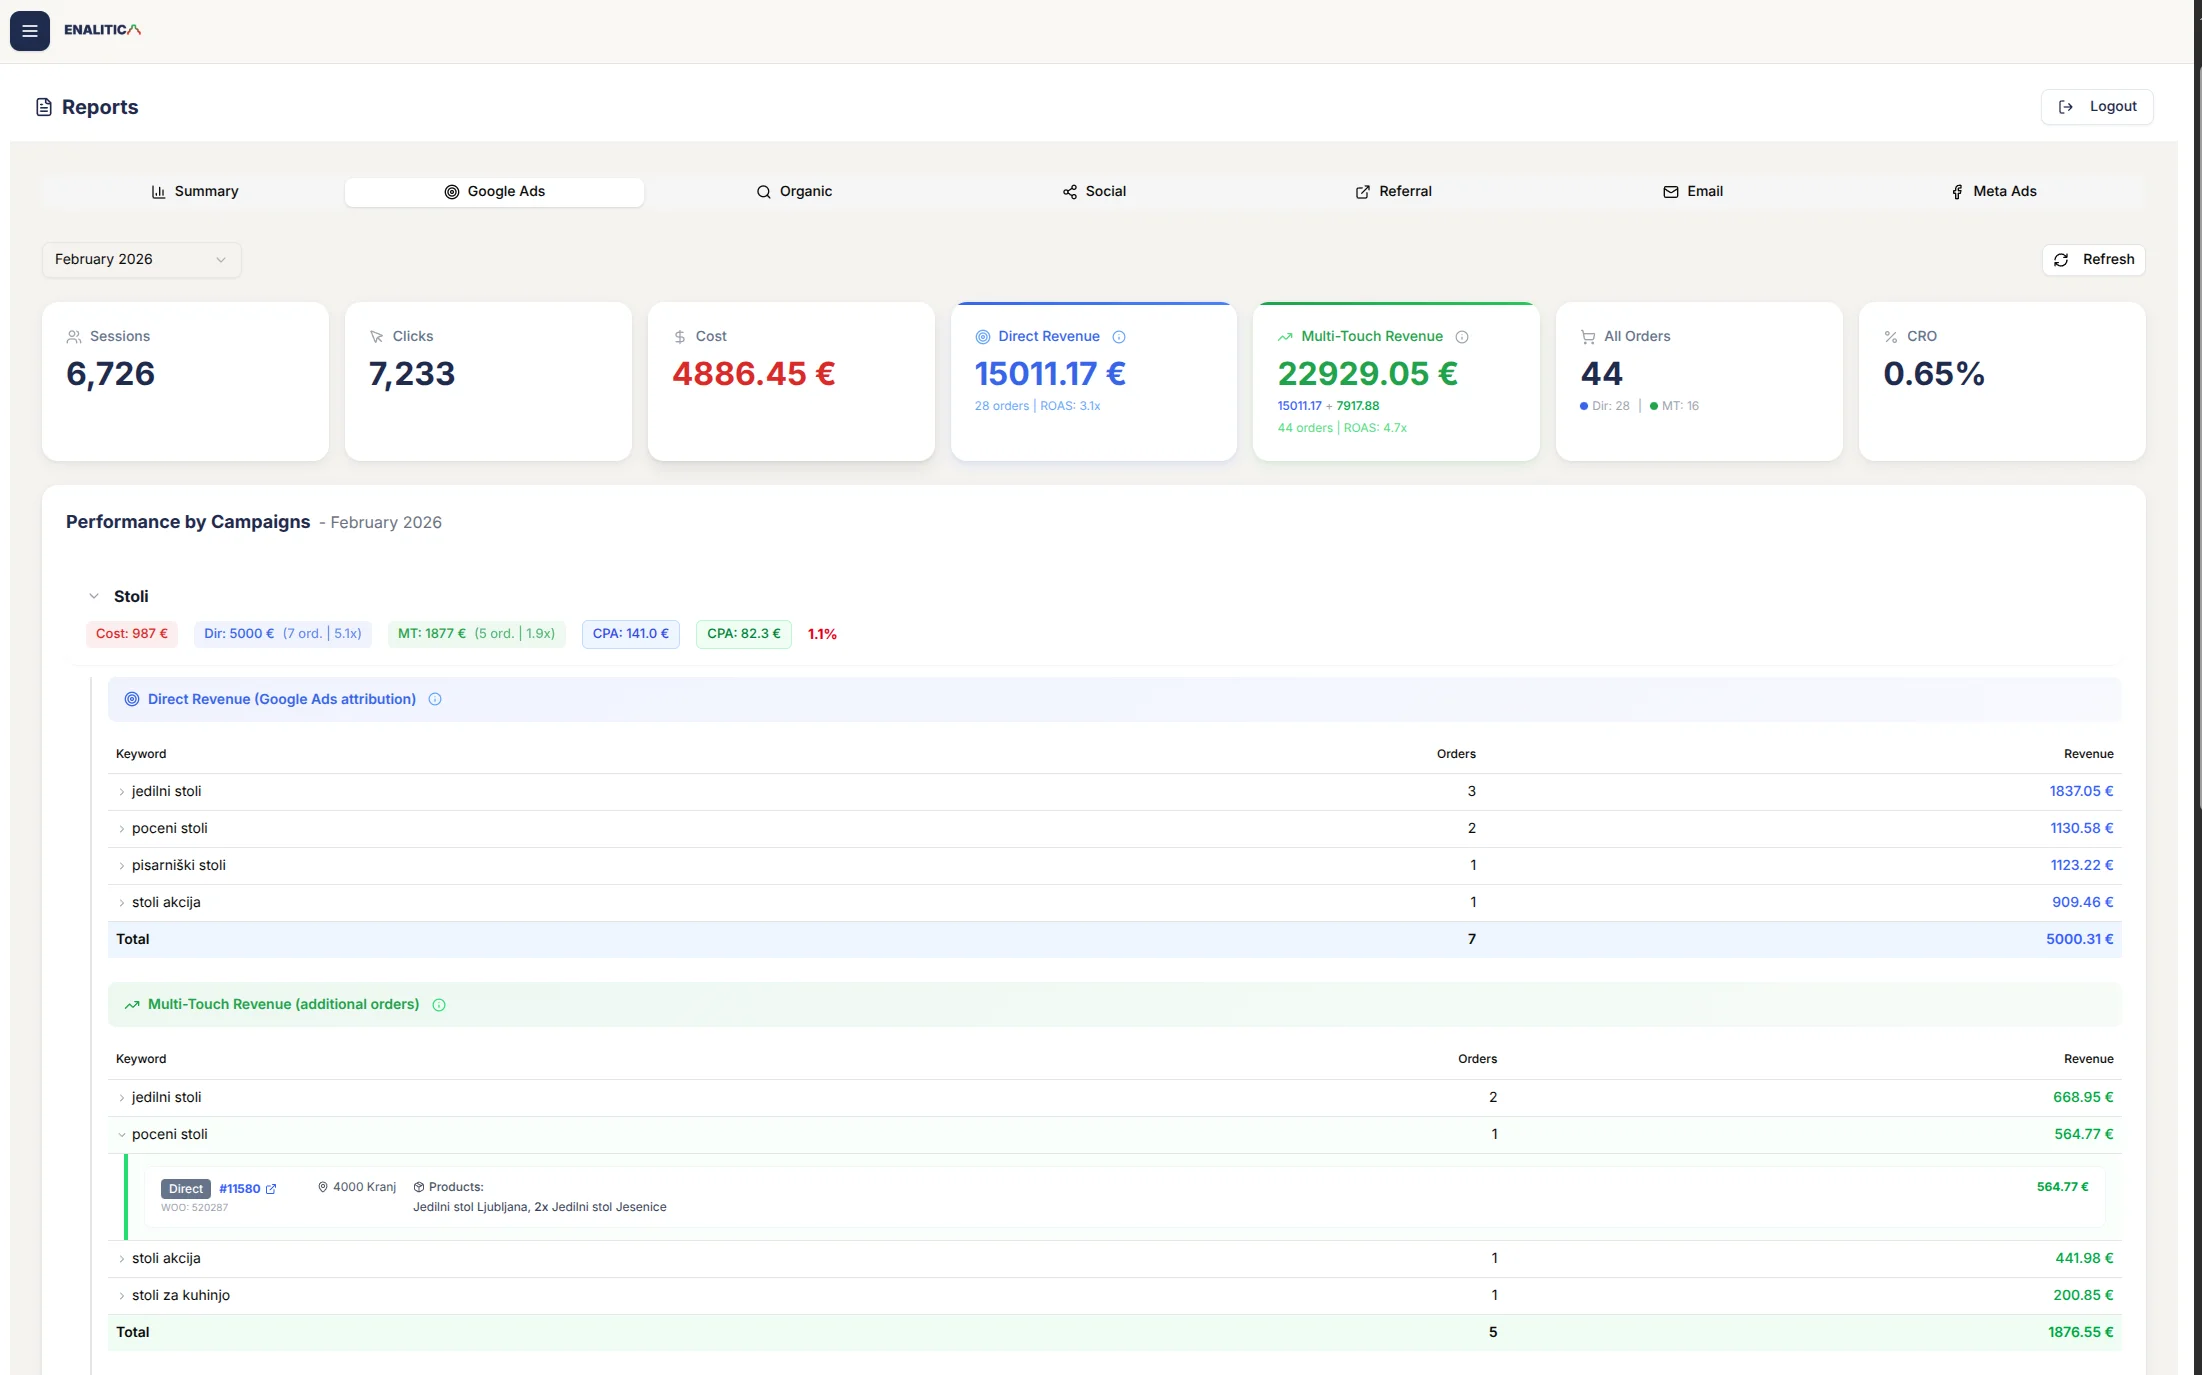
Direct Revenue shows orders where the channel was the last touch (closed the sale). Multi-Touch Revenue shows all orders where the channel appeared anywhere in the customer journey, including as the first touch.
For a real store in February 2026: Google Ads shows €15,011 Direct Revenue from 28 orders (ROAS 3.1x), but €22,929 Multi-Touch Revenue from 44 orders (ROAS 4.7x). The difference: 16 orders worth €7,918 where Google Ads introduced the customer, but another channel closed the sale.
Linear attribution would have given Google Ads a fraction of each order. Enalitica shows you the exact orders where Google Ads played a role, with the full customer journey visible per order. You can click any revenue number and see the order ID, products purchased, customer location, and the complete channel path.
The same direct-plus-multi-touch pair now exists for profit. Enalitica imports what each product costs you (from Shopify, WooCommerce, your price lists or your ERP), adds shipping, payment fees and packaging, and shows POAS (profit on ad spend) next to ROAS: direct POAS counts only the orders the campaign closed, MT POAS adds the profit of every order it assisted. Where linear attribution would split profit into arbitrary fractions, this shows the two honest bounds and the rule that follows from them: pause a campaign only when both POAS figures sit below 1.0.
Why order-based attribution replaces the need for linear
Linear attribution existed because marketers needed a way to credit all touchpoints, not just the first or last. Order-based attribution solves the same problem differently:
| What linear attribution tried to do | How order-based attribution actually does it |
|---|---|
| Credit all touchpoints fairly | Shows you the actual first touch and last touch per order |
| Prevent channels from being ignored | Multi-Touch Revenue captures every channel that participated |
| Provide a balanced view | Direct vs influenced revenue gives you both perspectives without arbitrary formulas |
| Simple, transparent math | Click any number to see the actual orders behind it |
The difference: linear attribution applies an equal-weight formula. Order-based attribution shows you the actual data and lets you draw your own conclusions. You do not need a formula when you can see the orders.
Attribution that survives privacy restrictions
Because Enalitica starts from the order database, the core data exists regardless of browser-side tracking:
| Factor | GA4 linear attribution (pre-2023) | Enalitica order-based |
|---|---|---|
| Ad blocker active | Touchpoint invisible, attribution chain broken | Order captured. Click IDs from order metadata still available |
| Cookie consent declined (EU) | No cross-session tracking possible | Click IDs stored in WooCommerce/Shopify database at order creation |
| Safari ITP (7-day purge) | Mid-journey cookies lost, linear credit miscalculated | Click IDs persisted in order metadata, not in browser cookies |
| Revenue accuracy | GA4 purchase events undercount by 15-30% | Actual order totals from your e-commerce platform |
| Model availability (2026) | ✗ Removed from GA4 | Not model-dependent, shows actual touchpoint data per order |
Enalitica onboarding takes just a few minutes. For e-commerce stores, your last 30 days of orders are imported and enriched with click ID and Google Ads data instantly. Service businesses get all tracked events imported immediately. Want to see first-touch and last-touch attribution for your actual orders, without relying on deprecated models or black-box algorithms? Book a demo and we will show you exactly which channels drive revenue across your full customer journey.
How to Evaluate Attribution for Your Store Today
Whether you use Enalitica or build your own approach, here are concrete steps to improve your attribution:
Stop relying on a single model. No attribution model (linear, first-touch, last-touch, or data-driven) tells the full story. Run at least two and compare. Where they agree, you have confidence. Where they disagree, investigate.
Capture click IDs in order metadata. This is the foundation of any attribution approach that survives privacy restrictions. Make sure GCLID, FBCLID, GBRAID, and WBRAID are stored with every order. For step-by-step setup, see our guide to capturing click IDs in WooCommerce.
Use GA4 "First user" dimensions alongside session dimensions. In GA4 Explorations, add "First user default channel group" next to "Session default channel group." This gives you a lightweight first-touch vs last-touch comparison without needing the deprecated linear model.
Audit your GA4 vs order gap. Compare GA4 purchase event count to actual orders last month. If the gap is over 15%, linear attribution (or any session-based model) was working with incomplete data. For stores in EU markets with strict cookie consent, this gap is typically 30-50%.
Calculate linear attribution manually if needed. If you still want equal-credit distribution, export your GA4 multi-channel funnel data and divide revenue by the number of touchpoints per conversion path. A simple spreadsheet formula does what the deprecated GA4 feature used to do.
Evaluate order-based attribution. If privacy-related tracking loss is significant for your store, consider platforms that start from orders rather than sessions. The data foundation is fundamentally more complete. For more on how different click IDs work across platforms, see our technical guide.
Frequently Asked Questions
How does the linear attribution model calculate credit?
The linear attribution model divides 100% of the conversion credit equally among all touchpoints in the customer journey. The formula is: credit per touchpoint = total conversion value / number of touchpoints. For a €100 order with 4 touchpoints, each touchpoint receives €25. The calculation does not consider the type of interaction, its duration, or when it occurred. Every touchpoint, from a 2-second bounce to a 10-minute product research session, gets the same share.
Linear attribution gives credit to _____.
The answer is all touchpoints equally. In the linear attribution model, every interaction in the customer journey receives an equal share of the conversion credit. Unlike first-touch attribution (which credits only the first interaction) or last-touch attribution (which credits only the final interaction), linear attribution distributes credit evenly across the entire path.
Which statement describes linear attribution?
The statement that best describes linear attribution is: "A multi-touch attribution model that distributes conversion credit equally across all touchpoints in the customer journey." Key characteristics: it is a rules-based model (not algorithmic), it is a multi-touch model (not single-touch), and it assigns the same weight to every interaction regardless of position or impact.
Is linear attribution still available in Google Ads or GA4?
No. Google removed linear attribution from both Google Ads and GA4 in September 2023. Conversion actions that used linear attribution were automatically migrated to data-driven attribution. The only remaining options are data-driven attribution (the default) and paid/organic last click. If you need linear-style equal credit distribution, you must calculate it manually using exported conversion path data or use a third-party analytics platform.
How does linear attribution differ from time-decay attribution?
Both are multi-touch models, but they weigh touchpoints differently. Linear attribution gives every touchpoint the same credit (e.g., 20% each for 5 touchpoints). Time-decay gives more credit to touchpoints closer to the conversion and less to earlier ones. For a €100 order with 5 touchpoints, linear gives each €20. Time-decay might give the last touch €35, the second-to-last €25, and progressively less to earlier touches. Time-decay works better for short purchase cycles where the final interactions are most influential. Linear works better when you believe each stage of the journey contributed roughly equally.
Can I use linear attribution for TV and offline advertising?
Linear attribution in the digital marketing context (Google Ads, GA4) is different from "linear TV attribution," which refers to attributing conversions to traditional (non-streaming) TV ads. Digital linear attribution divides credit equally among online touchpoints. Linear TV attribution uses statistical methods (like media mix modeling or geographic lift tests) to estimate how TV ad spend influenced online conversions. The term "linear" in "linear TV" refers to linear television broadcasting (scheduled programming), not the equal-credit distribution model. If you run both online ads and TV campaigns, you need separate measurement approaches for each.
What replaced linear attribution as the best multi-touch model?
There is no single replacement. Google's data-driven attribution is the default but operates as a black box. For marketers who valued linear attribution's transparency, the practical alternatives are: (1) Manual calculation in spreadsheets or data warehouses using exported conversion path data, (2) U-shaped (position-based) attribution, which gives 40% credit to first and last touch with 20% split among middle touches (also deprecated in GA4 but calculable manually), or (3) Order-based attribution, which sidesteps the modeling question entirely by showing you the actual touchpoints per order rather than applying a credit formula.
See your real numbers
Import 30 days of orders or leads instantly during 5-minute onboarding. Works for e-commerce and service businesses.
Start free