Multi-Touch Attribution for E-commerce
Learn how multi-touch attribution models work, why traditional tracking is breaking, and how order-based attribution gives e-commerce stores the full picture.

Tilen Ledic
Written by
If you run an e-commerce store with any meaningful ad spend, here is a scenario you have probably lived through. A customer clicks your Google Ad on Monday. They browse a few products, leave without buying. On Wednesday, they find you again through organic search and read a product review. On Friday, they open your email newsletter and finally place an order.
Google Ads reports zero conversions from that campaign. GA4 credits the email. Your email platform also claims the sale. And you, looking at three different dashboards with three different stories, have no idea which channel actually drove the revenue.
This is the core problem that multi-touch attribution solves. Or at least, tries to solve. Because the reality in 2026 is that traditional multi-touch attribution is under enormous pressure from privacy regulations, ad blockers, and browser restrictions. The models still matter, but the data feeding them has massive gaps.
I have spent the last two years building attribution systems for e-commerce stores at Enalitica, and the biggest lesson is this: the attribution model you choose matters far less than the data quality underneath it. In opt-out markets like the US, you can attribute 95-98% of ad-driven orders with server-side tracking. In strict EU markets like France or Germany, consent laws cap you at 30-50% regardless of your setup. But even then, the question is: do you know exactly what drove that 30-50%, or are you guessing? With order-based multi-touch attribution, you get precise, order-level data for every consented user, so you know exactly which ads, keywords, and channels drove that revenue. That is infinitely more actionable than a sophisticated model running on sampled, incomplete GA4 sessions.
This article covers everything you need to know about multi-touch attribution as an e-commerce store owner: the models, where they break, and what actually works when half your visitors are invisible to traditional tracking. If you want the broader picture first, our complete guide to ecommerce attribution maps how every model and approach fits together.
What Is Multi-Touch Attribution?
Multi-touch attribution (MTA) is a measurement approach that distributes credit for a conversion across multiple marketing touchpoints rather than giving all credit to a single interaction.
The concept is straightforward. A customer interacts with your brand multiple times before purchasing. A first-click model gives 100% credit to the first interaction. A last-click model gives 100% credit to the last one. Multi-touch attribution splits the credit across all interactions in the journey.
Why does this matter? Because modern purchase journeys are long. Forrester research shows that buyers need an average of 27 touchpoints before converting, often across 9 different channels. For B2B, buying cycles typically stretch 6 to 10 months. Even in e-commerce, where cycles are shorter, most customers with orders above €50 touch 3-5 channels before buying.
If you only credit the last click, you systematically undervalue everything that happened before it. Brand awareness campaigns, content marketing, social media presence, and top-of-funnel ads all get zero credit. Over time, you cut the budgets that were quietly filling your funnel, and you wonder why performance drops.
The 6 Multi-Touch Attribution Models
Not all multi-touch models distribute credit the same way. Here is how the main models work, with a practical example.
The example journey: A customer discovers your store through these touchpoints before placing a €100 order:
- Clicks a Google Ad (Day 1)
- Visits from organic search (Day 5)
- Clicks a Facebook ad (Day 8)
- Opens an email (Day 12)
- Visits directly and purchases (Day 14)
| Model | How credit is distributed | Google Ads | Organic | Direct | ||
|---|---|---|---|---|---|---|
| First-click | 100% to first touchpoint | €100 | €0 | €0 | €0 | €0 |
| Last-click | 100% to last touchpoint | €0 | €0 | €0 | €0 | €100 |
| Linear | Equal split across all | €20 | €20 | €20 | €20 | €20 |
| Time-decay | More credit to recent touches | €5 | €10 | €15 | €25 | €45 |
| U-shaped | 40% first, 40% last, 20% split middle | €40 | €7 | €7 | €7 | €40 |
| Data-driven | ML-based, varies by actual patterns | Varies | Varies | Varies | Varies | Varies |
Let me break each one down.
First-Click Attribution
All credit goes to the touchpoint that first introduced the customer to your brand. In the example, Google Ads gets €100. For a deep dive into when this model works and where it fails, see our complete guide to first-touch attribution.
Best for: Understanding which channels drive new customer acquisition. Useful when growing brand awareness is your primary goal.
Limitation: Completely ignores everything that happened between discovery and purchase. The email that nudged the customer to buy gets zero credit.
Last-Click Attribution
All credit goes to the final touchpoint before purchase. This is still the default in most reporting. An EMARKETER/Snap survey found that 78% of marketers still use last-click, yet only 21% are confident it accurately reflects long-term business impact. For the full breakdown of when last-touch works and its 6 key drawbacks, see our guide to last-touch attribution.
Best for: Identifying which channels close sales. Simple to implement and understand.
Limitation: Systematically undervalues top-of-funnel activities. If you only optimize for last-click, you end up cutting awareness campaigns that were feeding your conversion channels. Forrester estimates that companies using advanced attribution models achieve 15-30% improvement in marketing ROI.
Linear Attribution
Equal credit to every touchpoint. Five touches, each gets 20%.
Best for: When you genuinely believe every touchpoint contributes equally. Works for simple journeys with few touchpoints.
Limitation: Treating a random organic visit the same as a targeted ad click rarely reflects reality. A customer browsing casually on Day 5 probably contributed less than the ad that first brought them in.
Time-Decay Attribution
More credit to touchpoints closer to the conversion. The further back in time, the less credit.
Best for: Short sales cycles and promotional campaigns where recent interactions are most influential. If you run flash sales or seasonal promotions, this model captures the urgency factor.
Limitation: Undervalues the initial discovery touchpoint. The Google Ad that introduced the customer gets almost nothing, even though without it the entire journey never starts.
U-Shaped (Position-Based) Attribution
40% credit to the first touch, 40% to the last touch, and 20% split among everything in between.
Best for: Balancing acquisition and conversion. Recognizes that the first and last interactions are typically the most important while still giving some credit to middle touchpoints.
Limitation: The 40/40/20 split is arbitrary. Why not 30/30/40? The model assumes the first and last touches matter most, which is often true but not always.
Data-Driven Attribution
Uses machine learning to analyze your actual conversion data and assign credit based on observed patterns. GA4 now uses this as its default model.
Best for: Large accounts with enough conversion data for the algorithm to learn from. Google recommends at least 200 conversions and 2,000 ad interactions within 30 days for the model to produce reliable results.
Limitation: It is a black box. You cannot see exactly why the model assigned 35% to Google Ads and 15% to email. It also requires substantial data volume, and for smaller stores, it often falls back to simpler models silently.
Which Model Wins?
None of them, universally. The model choice depends on your business:
| Your situation | Recommended model | Why |
|---|---|---|
| Small store, few channels | Last-click or first-click | Simple, enough data points |
| Growing store, 3-5 channels | U-shaped | Balances acquisition and conversion |
| Short purchase cycles (<7 days) | Time-decay | Recent touches drive purchase decisions |
| Large store, 200+ conversions/month | Data-driven | Let the algorithm learn your patterns |
| Long B2B cycles | W-shaped | Captures lead creation milestones |
Key takeaway: The model matters less than the data feeding it. A perfect U-shaped model is useless if 40% of your customer journeys are invisible because of ad blockers and cookie consent. Which brings us to the real problem.
Why Traditional Multi-Touch Attribution Is Breaking
Multi-touch attribution was designed for a world where you could track every user interaction across every channel. That world no longer exists. Here is what is eating your attribution data in 2026.
Ad Blockers: 31-42% of Users Are Invisible
Between 912 million and 1 billion people worldwide use ad blockers. Depending on your audience demographic, 31-42% of your visitors are completely invisible to JavaScript-based tracking like GA4. They visit your store, browse products, and buy. Your analytics never knows they existed.
Cookie Consent: Over 75% Rejection in Strict EU Markets
Under GDPR, you must ask for consent before setting analytics and advertising cookies. In strict-enforcement countries like France and Germany, fewer than 25% of visitors accept tracking cookies. Those visitors are tracked only as anonymous sessions with no cross-visit attribution. For a detailed breakdown of consent rates by country, see our country-by-country attribution guide.
Safari ITP: 7-Day Cookie Purge
Safari's Intelligent Tracking Prevention deletes first-party cookies set via JavaScript after 7 days. If a customer clicks your ad on Monday and returns to buy on the following Tuesday (Day 8), the cookie linking those sessions is gone. Safari holds roughly 23% of mobile browser market share globally, and over 50% in the US.
iOS App Tracking Transparency
Since iOS 14.5, Apple requires apps to ask permission before tracking. About 65% of users deny it. This directly impacts Facebook/Meta attribution (FBCLID tracking) and forces Google to use privacy-preserving identifiers like GBRAID and WBRAID instead of the full GCLID.
The Compounding Effect
These are not independent problems. They stack. A single visitor can be affected by multiple factors simultaneously:
- Visitor uses Safari on iPhone (ITP active) + declines cookie consent + has an ad blocker on desktop
- Result: You lose tracking data at every step of their journey
Here is what realistic data loss looks like for a European e-commerce store:

| Data loss factor | Affected users | Impact |
|---|---|---|
| Ad blockers | 31-42% | Complete tracking loss |
| Cookie consent rejection (EU) | 40-50% of remaining | No cross-session attribution |
| Safari ITP (7-day purge) | 27% of mobile users | Breaks journeys > 7 days |
| iOS ATT denial | 65-75% of iOS users | Degrades Meta attribution |
| GA4 data sampling | Varies at scale | Incomplete data at volume |
| Compounded realistic loss | 50-70% | Of total customer journeys |
The bottom line: If you sell to European customers, traditional JavaScript-based multi-touch attribution can only see 30-50% of your actual customer journeys. You are building your attribution model on a fraction of reality.
GA4 Data-Driven Attribution: What It Does and Does Not Do
Google Analytics 4 made data-driven attribution its default model in late 2023, replacing last-click. This was a significant improvement, but it does not solve the fundamental problems.
What GA4 DDA Does Well
- Uses machine learning to assign credit based on your actual data patterns
- Available to all GA4 users for free (previously limited to GA360)
- Considers factors like device type, number of interactions, time to conversion, and order of exposure
- Better than last-click for most stores, especially those with multi-channel traffic
What GA4 DDA Cannot Fix
- It tracks sessions, not orders. GA4 fires a JavaScript event when a purchase happens. If that event does not fire (ad blocker, consent rejection, tracking error), the order is invisible. Your WooCommerce dashboard shows 100 orders. GA4 shows 70 purchase events. Those missing 30 orders are gone from the attribution model.
- It cannot attribute what it cannot see. If a customer's first visit was blocked by an ad blocker but their purchase session was tracked, GA4 treats it as a single-touch journey. The multi-touch history is lost.
- It samples at scale. For large stores, GA4 does not show all data. Reports use sampled data, and the sampling rate depends on the date range and complexity of your query.
- Revenue is always lower than actual. GA4 purchase events consistently undercount compared to your actual order management system. If you are making budget decisions based on GA4 revenue, you are working with deflated numbers.
Honest assessment: GA4 data-driven attribution is free, it is better than last-click, and for small stores with US-only traffic, it might be enough. But if you advertise in markets with strict privacy laws, or if your store processes more than a few hundred orders per month, the data gaps become decision-altering.
Order-Based Attribution: Starting From Real Revenue
There is a fundamentally different approach to multi-touch attribution that flips the traditional model. Instead of tracking user sessions and hoping they lead to orders, you start from confirmed orders and attribute backwards.
The logic is simple: an order in your WooCommerce or Shopify backend is a fact. It happened. The customer paid, you shipped the product. No ad blocker, cookie consent banner, or browser restriction can make that order disappear. The question is not "did a conversion happen?" but "what marketing touchpoints led to this specific order?"
How Order-Based Attribution Works
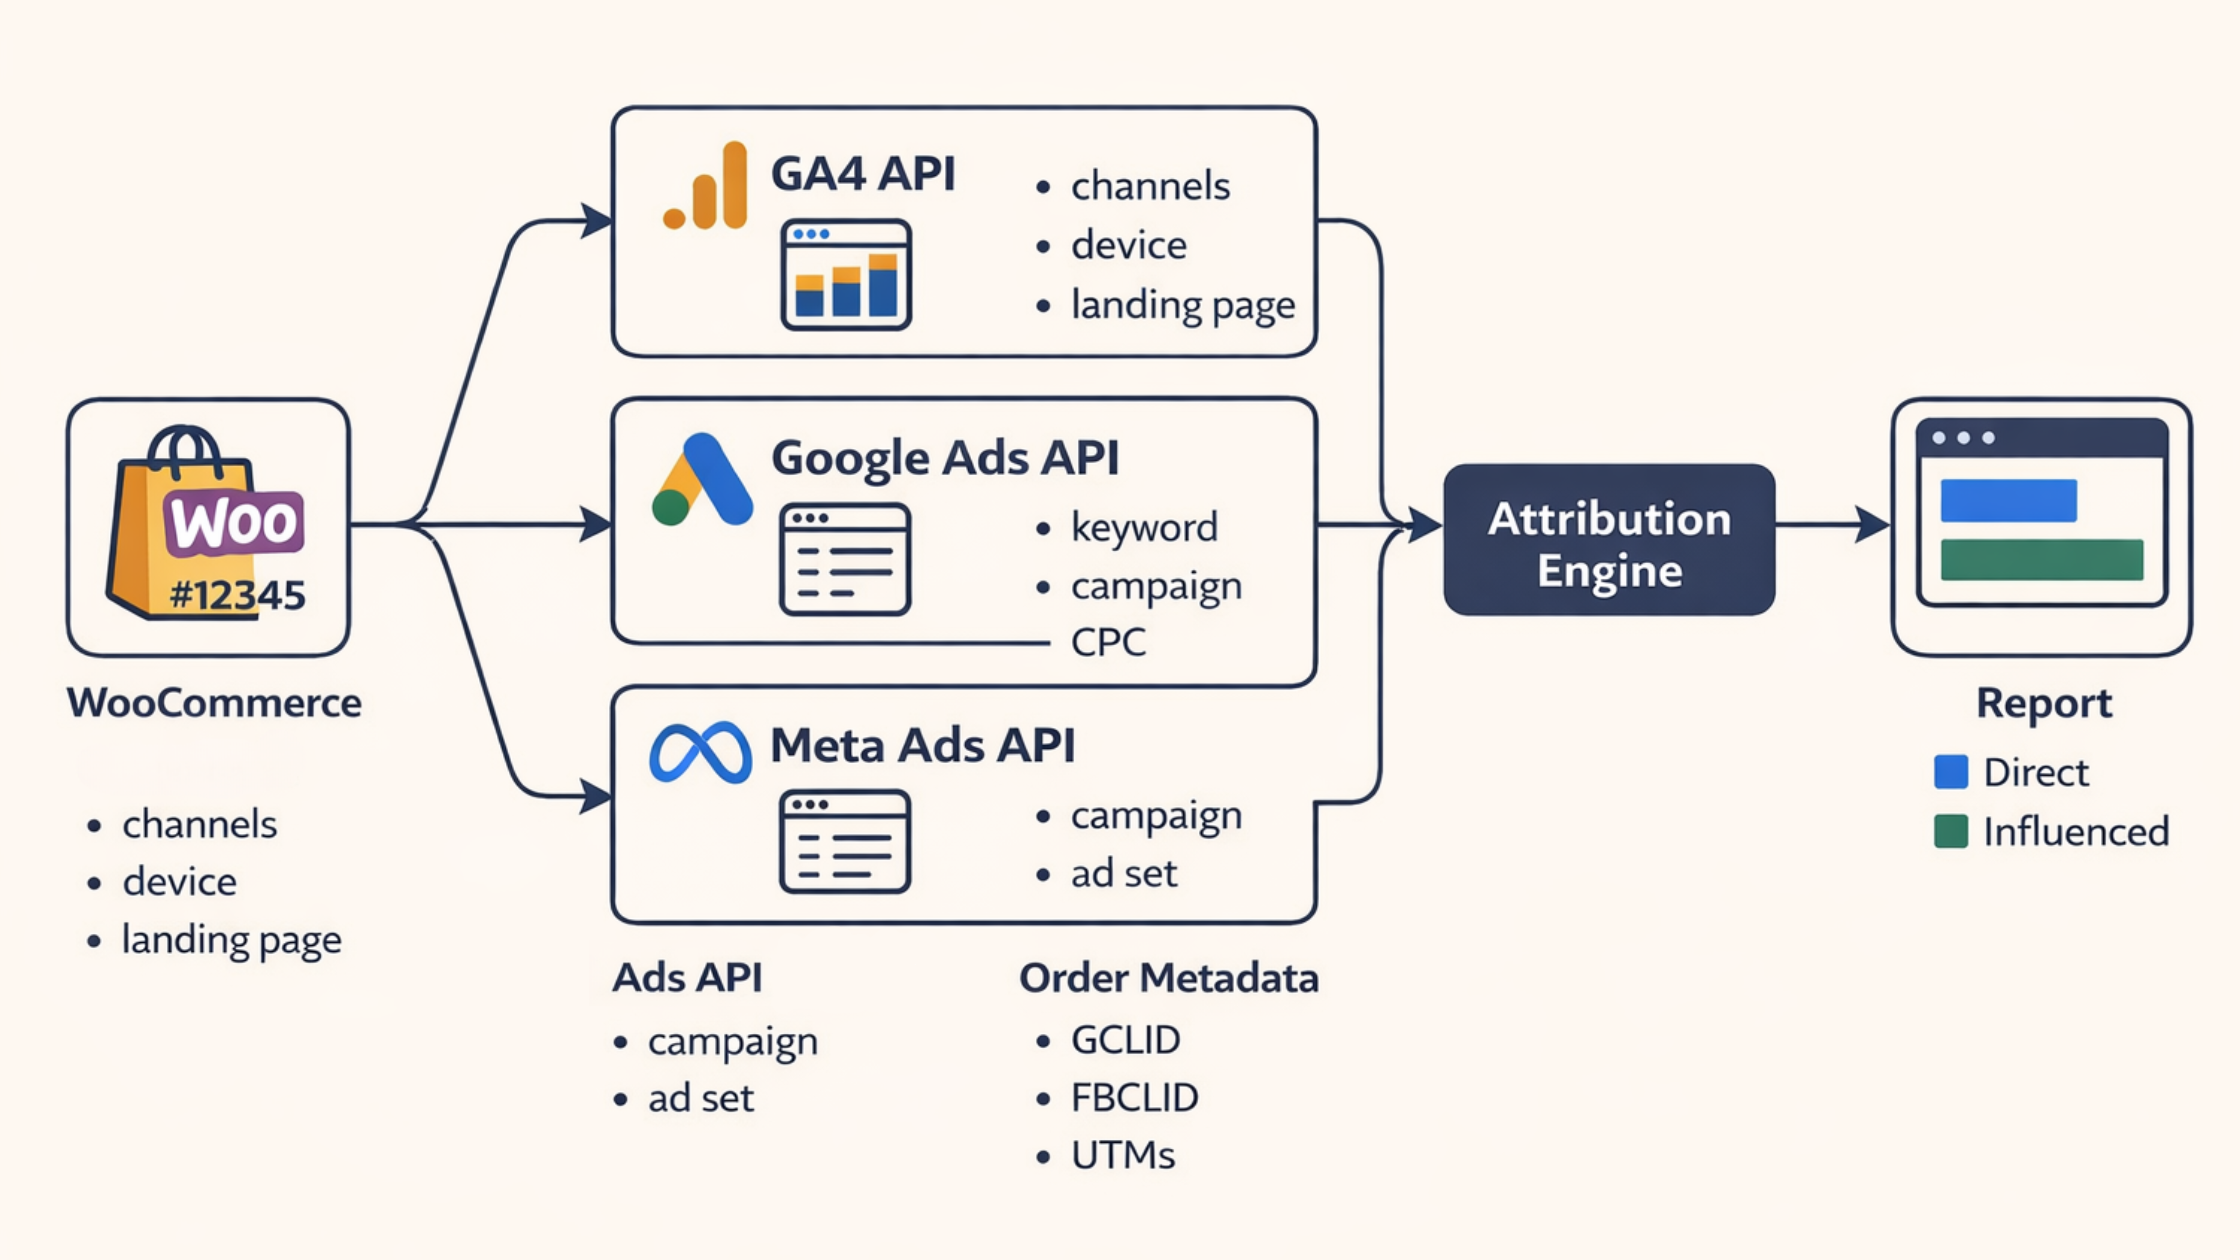
The data pipeline looks like this:
- Order import: A WooCommerce order is created. The system captures the order total, products, customer data, and any click identifiers (GCLID, FBCLID) and UTM parameters stored in the order metadata.
- Cross-device stitching: If the customer entered their email earlier in the journey, even on a different device, the system matches a SHA-256 hash of that email to the order and fills in the click IDs captured on that first device. This recovers phone-to-desktop journeys that cookies alone cannot see. It works within a short matching window and only for consented visits, so it is not magic, but it closes the single biggest gap between our numbers and the ad platforms'.
- GA4 enrichment: The system queries the GA4 API using the transaction ID to retrieve the session channel, first-touch channel, landing page, device, and location data for that specific order.
- Google Ads enrichment: If a GCLID is present, the Google Ads API returns the exact keyword, campaign, ad group, cost-per-click, and match type for that click.
- Meta Ads enrichment: If an FBCLID is present, the Meta API returns the campaign and ad set information.
- Attribution calculation: A rules engine determines the primary attribution channel based on all available data.
- Server-side conversions: Verified, deduplicated purchase events are sent back to Meta (Conversions API) and Google server-side, so their bidding algorithms still get accurate signal even when the browser pixel was blocked.
The result is a complete record for every order: which ad was clicked, which keyword triggered it, what the customer's first and last touchpoints were, and the exact revenue generated.
Two-Dimensional Attribution: Direct vs. Influenced Revenue
This is where order-based attribution gets genuinely useful for budget decisions. For every channel, you see two numbers:
Direct revenue: Orders where the customer interacted with this channel in the converting session. This is comparable to what the ad platform itself reports.
Multi-touch (influenced) revenue: Orders where the customer interacted with this channel at any point in their journey, even if they converted through a different channel.
Here is what that looks like in practice:
| Channel | Direct revenue | Influenced revenue | Hidden influence |
|---|---|---|---|
| Google Ads | €15,000 | €28,000 | €13,000 in orders Google Ads touched but another channel closed |
| Organic Search | €22,000 | €35,000 | €13,000 in orders with organic in the journey |
| €8,000 | €12,000 | €4,000 where email was one of multiple touchpoints | |
| Direct | €18,000 | €25,000 | €7,000 attributed to "direct" but other channels assisted |
Why this matters: Without the "influenced" column, you might look at Google Ads' €15,000 in direct revenue and decide the ROAS is not good enough to justify the spend. But if those ads actually touched €28,000 worth of orders, nearly double what the platform reports, cutting the budget would hurt channels that appear to be performing well on their own.
This is the core insight of multi-touch attribution: channels do not work in isolation. An ad introduces the customer, organic search builds familiarity, and email closes the sale. Credit just one of them and you make bad decisions about the other two.
The same direct-plus-multi-touch pair now exists for profit. Enalitica imports what each product costs you (from Shopify, WooCommerce, your price lists or your ERP), adds shipping, payment fees and packaging, and shows POAS (profit on ad spend) next to ROAS in every campaign table: direct POAS counts only the orders the campaign closed, while MT POAS adds the profit of every order it assisted. A campaign can look weak on its direct numbers and still earn through assists, which is why the rule is to pause only when both POAS figures sit below 1.0.
Here is what this looks like in a real dashboard. The "Stoli" campaign spent €987 on Google Ads. Direct attribution shows €5,000 in revenue from 7 orders (ROAS 5.1x). But multi-touch attribution reveals an additional €1,877 in influenced revenue from 5 more orders where these keywords were part of the customer journey. The true campaign value including multi-touch influence: €6,877, not €5,000. And you can drill down to every individual order to see the products, location, and order value.
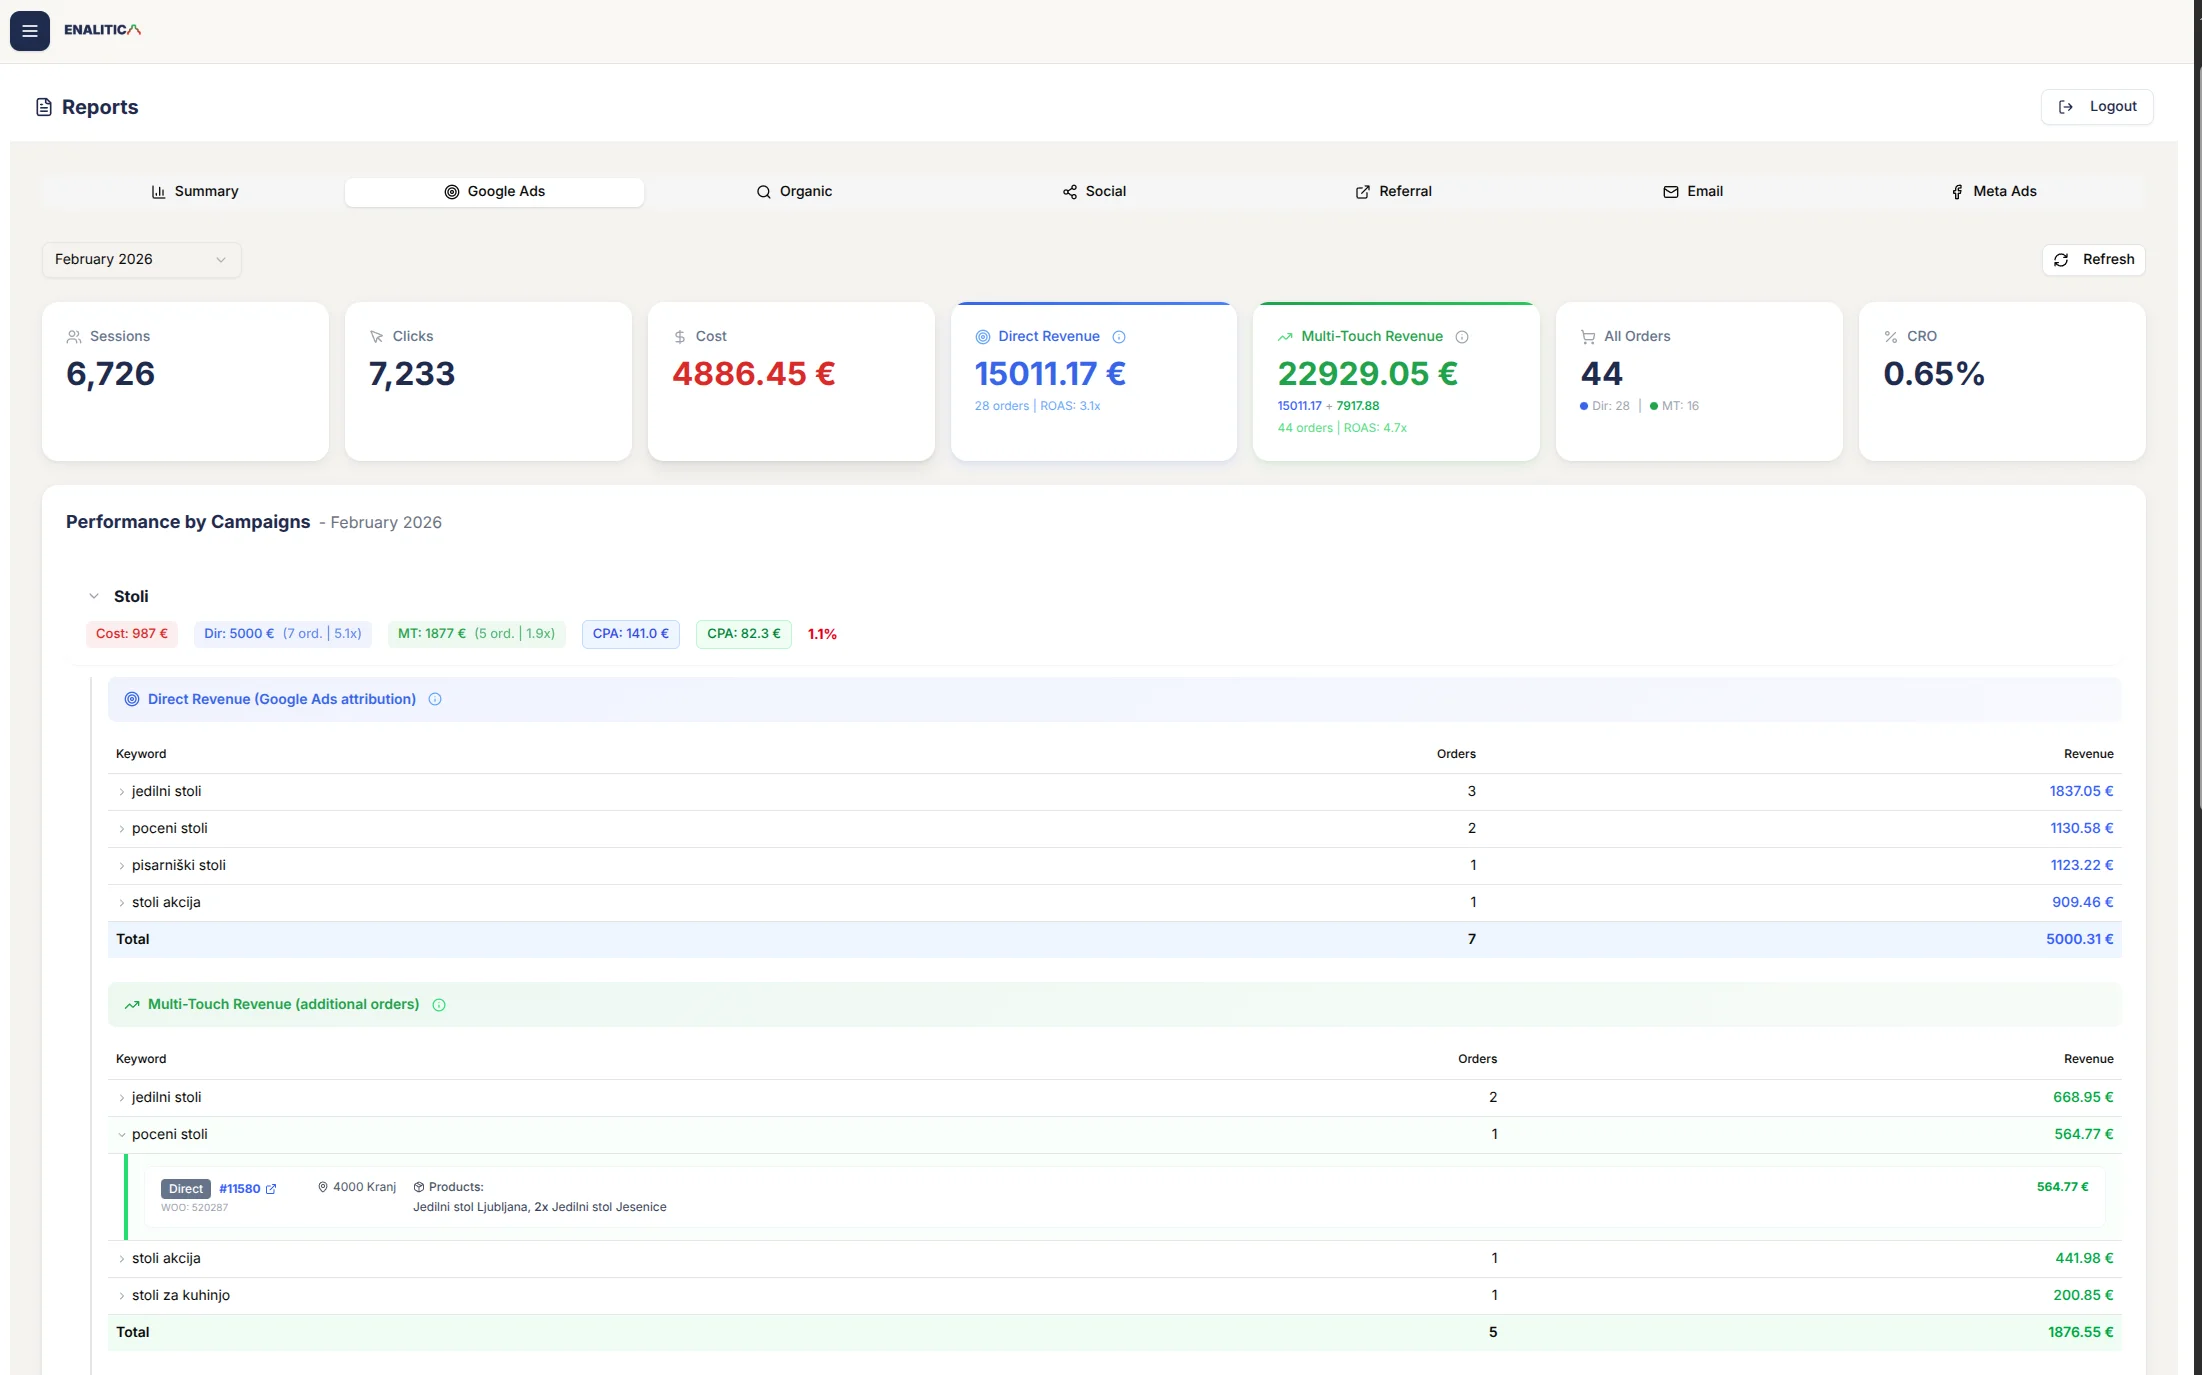
Enalitica onboarding takes just a few minutes. For e-commerce stores, your last 30 days of orders are imported and enriched with click ID and Google Ads data instantly. Service businesses get all tracked events imported immediately. Want to see your own Google Ads, Meta Ads, and organic channels broken down like this? Book a demo and we will show you exactly where your hidden revenue is.
The Attribution Rules Engine
When an order has touchpoints from multiple channels, a rules engine determines the primary channel to prevent double-counting in aggregate reports. This is the opposite of how Meta and Google dashboards work, where each platform claims credit independently and the totals across platforms exceed actual revenue (see How Meta, Google, and Enalitica Count Conversions for a side-by-side comparison). The Enalitica rules:
- Purchase session was Paid Search + valid GCLID exists → Google Ads (direct)
- Purchase session was Paid Social + valid FBCLID exists → Meta Ads (direct)
- Valid GCLID exists but from a different session → Google Ads (influenced)
- Valid FBCLID exists but from a different session → Meta Ads (influenced)
- Both GCLID and FBCLID exist → Most recent click gets primary attribution
- No valid click IDs → Session channel (last-touch)
- Fallback → First channel (first-touch)
Attribution windows follow platform standards: 90 days for GCLID (matching Google Ads), 28 days for FBCLID (matching Meta).
Why Order-Based Attribution Recovers Lost Data
The key advantage of starting from orders rather than sessions is that several data loss factors affecting traditional tracking have reduced or zero impact:
| Factor | Session-based (GA4) | Order-based |
|---|---|---|
| Ad blockers | Loses 30-40% of sessions | Zero impact. Orders exist regardless. |
| Cookie consent rejection | Loses 40-50% in EU | Orders still captured. Click IDs available only for consented users, but you get exact multi-touch attribution for every consented order. |
| Safari ITP | Breaks attribution after 7 days | Click IDs captured at checkout persist in order metadata. |
| Cross-device (phone → desktop) | Appears as two separate users, journey broken | Recovered via SHA-256 email-hash stitching when an email was captured. |
| Revenue accuracy | GA4 purchase events undercount | Actual order totals from WooCommerce/ERP. |
| Keyword-level ROAS | Not available in GA4 | Exact keyword → order → revenue chain via GCLID. |
| Order drill-down | Not possible | Click any metric to see the individual orders behind it. |
The GA4 enrichment step still depends on GA4 tracking being present for that session, so you do not get 100% coverage on session-level data. But you always have the order, the revenue, and any click IDs that were captured in the order metadata. The attribution picture is substantially more complete.
MTA vs. MMM vs. Incrementality Testing
Multi-touch attribution is not the only measurement approach available. Here is how the three main methods compare:
| Multi-Touch Attribution | Marketing Mix Modeling | Incrementality Testing | |
|---|---|---|---|
| What it measures | Individual user journeys | Aggregate channel contribution | Causal impact of specific changes |
| Data level | User/session | Market/campaign level | Experiment-level |
| Answers | "Which touchpoints led to this conversion?" | "How much revenue did each channel drive overall?" | "Did this campaign actually cause incremental sales?" |
| Time to deploy | Weeks | Months (needs 2-3 years of data) | Weeks per test |
| Privacy impact | High (needs user tracking) | Low (uses aggregate data) | Moderate (needs control groups) |
| Real-time optimization | ✓ | ✗ | ✗ |
| Accounts for external factors | ✗ | ✓ (seasonality, economy, competitors) | ✓ (via controlled experiments) |
| Best for | Daily/weekly campaign optimization | Quarterly/annual budget allocation | Validating specific channel impact |
It is worth understanding what the dedicated attribution platforms actually do here, because their own positioning makes the point for us. Tools like Northbeam and Triple Whale still run on a first-party tracking pixel, so they are subject to the same consent and capture limits as everyone else. And they openly acknowledge that multi-touch attribution measures correlation, not causation: it can show that conversions rose while a campaign was live, but it cannot prove the campaign caused them. That is precisely why these tools now layer marketing mix modeling and incrementality testing on top of MTA. The multi-touch number alone was never meant to be the final word.
The practical recommendation: Use MTA for day-to-day decisions about which campaigns and keywords to scale. Use incrementality testing to validate that your best-performing channels are actually driving new revenue (not just capturing existing demand). If you are large enough, add MMM for long-term strategic budget allocation. We will cover MMM and incrementality testing in depth in future posts.
How to Choose the Right Attribution Approach for Your Store
The right approach depends on your scale, your markets, and what decisions you need to make.
If you sell primarily to US/Australia/Canada customers
Traditional GA4 data-driven attribution will capture most of your data. Consent rates are high, ad blocker usage is lower in older demographics, and there is no mandatory opt-in requirement. Start here and move to order-based attribution when you want keyword-level ROAS or when your GA4 purchase count consistently runs below your actual order count.
If you sell to European customers
You need server-side or order-based attribution. With fewer than 25% of visitors accepting cookies in strict markets like Germany, France, and the Netherlands, GA4 is missing too much data for reliable multi-touch attribution. Check our country-by-country breakdown to see exactly how much data you are losing in each market.
If you spend €5,000+ per month on ads
At this spend level, even a 10% improvement in attribution accuracy can shift thousands of euros in budget toward channels that actually drive revenue. The ROI on better attribution data pays for itself quickly.
If your customers have multi-session purchase journeys
If your average customer visits 2-3 times before buying (common for products above €50), single-touch attribution is actively misleading. You need at minimum a U-shaped or time-decay model, fed with data that can track cross-session behavior.
Implementation Checklist
If you want to improve your multi-touch attribution today, here are the concrete steps, ordered by impact:
Audit your UTM tagging. Every campaign, every ad set, every email link should have consistent UTM parameters. Inconsistent UTMs are the number one cause of attribution data being bucketed as "(not set)" or "unassigned." Use a naming convention and enforce it.
Capture click IDs in your order metadata. If you use WooCommerce, make sure GCLID, GBRAID, WBRAID, and FBCLID are captured and stored with each order. This is the foundation of order-based attribution. See our step-by-step guide to capturing click IDs in WooCommerce.
Set appropriate lookback windows. Check your actual time-to-purchase data. If 90% of customers buy within 7 days of first visit, a 30-day window is fine. If you sell high-consideration products, extend to 60-90 days. Google Ads uses 90 days for GCLID attribution, Meta uses 28 days.
Compare GA4 purchase events to actual orders. Run a simple check: how many orders did your store process last month? How many purchase events did GA4 record? If the gap is larger than 15%, you have a significant tracking problem that will distort any attribution model.
Implement server-side tracking. Server-side tracking recovers 15-30% of conversion signals lost to ad blockers and consent rejection. Enterprise adoption of server-side tracking is accelerating rapidly, especially among EU-focused businesses. This is no longer optional for stores selling in the EU. If you route Meta CAPI through sGTM, see our comparison of three setups beyond the default Meta CAPI tag before standing up a new container.
Stop optimizing on a single metric. Look at both direct and influenced revenue per channel. A channel with low last-click conversions might be the top-of-funnel driver that feeds all your other channels.
Review attribution monthly, not daily. Attribution data needs time to settle. Orders placed at the end of the month may not complete their journey for days or weeks. Monthly reviews give a more stable and accurate picture.
Accept that perfect attribution does not exist. No model, no tool, no approach gives you 100% accurate attribution. The goal is directional accuracy: understanding which channels matter most, which are undervalued, and where to invest more. An 80% accurate picture is infinitely better than a last-click default that ignores the entire customer journey.
Frequently Asked Questions
Is multi-touch attribution dead?
No, but it has changed significantly. Traditional cookie-based MTA has lost much of its data foundation due to privacy regulations and browser restrictions. The MTA market is projected to grow from $2.4 billion in 2025 to $5.2 billion by 2031. What is "dead" is the assumption that you can track every user interaction through browser cookies. What is replacing it is a combination of server-side tracking, first-party data, and order-based attribution that does not depend on browser-side tracking.
Does GA4 support multi-touch attribution?
GA4 uses data-driven attribution by default, which is a form of multi-touch. It uses machine learning to distribute credit across touchpoints based on observed conversion patterns. However, GA4 can only attribute what it can track, and it loses 30-50% of conversions in privacy-conscious markets due to ad blockers and cookie consent rejection. For stores with primarily US traffic, GA4 DDA is a reasonable starting point.
Which multi-touch attribution model is best for e-commerce?
For most e-commerce stores, U-shaped (position-based) attribution is a strong default. It gives appropriate credit to the channel that introduced the customer (first touch) and the channel that closed the sale (last touch), while acknowledging middle touchpoints. If you have enough conversion data (200+ per month), data-driven attribution will outperform any rule-based model because it learns from your actual customer behavior.
How is multi-touch attribution different from marketing mix modeling (MMM)?
MTA works at the individual user level, tracking specific touchpoints in a customer's journey. MMM works at the aggregate level, using historical data to model overall channel contribution. MTA is better for tactical, day-to-day optimization. MMM is better for strategic, quarterly budget allocation. They complement each other. Neither replaces the other.
What is the difference between multi-touch attribution and last-click?
Last-click gives 100% credit to the final touchpoint before purchase. Multi-touch distributes credit across all touchpoints in the journey. The practical difference: with last-click, a customer who clicked your Google Ad, visited three times organically, and finally bought via email gets attributed entirely to email. Multi-touch would credit Google Ads for the introduction, organic for nurturing, and email for conversion. Forrester estimates that companies using advanced attribution models achieve 15-30% improvement in marketing ROI.
How much data do I need for reliable multi-touch attribution?
For rule-based models (linear, time-decay, U-shaped), you can start with any volume. The model itself is a fixed formula. For data-driven attribution (GA4 DDA or custom ML models), Google recommends at least 200 conversions and 2,000 ad interactions within 30 days for reliable results. Below that threshold, the algorithm lacks enough data to identify meaningful patterns and may silently fall back to simpler models.
Can I do multi-touch attribution without cookies?
Yes, through server-side approaches. Order-based attribution captures click identifiers (GCLID, FBCLID) in the order metadata at the moment of purchase, then enriches that data through API calls to GA4, Google Ads, and Meta. The attribution chain is server-side, so cookie expiration and browser restrictions do not break it. The trade-off is that you need the click ID to be captured initially, which still requires some client-side mechanism (a hidden form field, a server-side cookie, or URL parameter forwarding).
What does multi-touch attribution cost?
It ranges widely. GA4 data-driven attribution is free. Dedicated MTA platforms like Northbeam, Triple Whale, or Rockerbox typically start at $500-2,000/month for small to mid-size stores. Order-based attribution tools vary by platform and scale. The more relevant question is: how much revenue are you misallocating because of incomplete attribution? Forrester estimates that unified measurement improves marketing budget efficiency by 15-20%, which often pays for the tooling many times over. For a detailed comparison of attribution platforms and their pricing, see our guide to Triple Whale alternatives.
See your real numbers
Import 30 days of orders or leads instantly during 5-minute onboarding. Works for e-commerce and service businesses.
Start free