
Cost per Qualified Lead: The Number That Decides Your Ad Budget
Cost per qualified lead, computed honestly: the CPQL formula, your break-even cost per lead, ROI per channel and what a CRM loop adds. With worked numbers.

Tilen Ledic
Written by
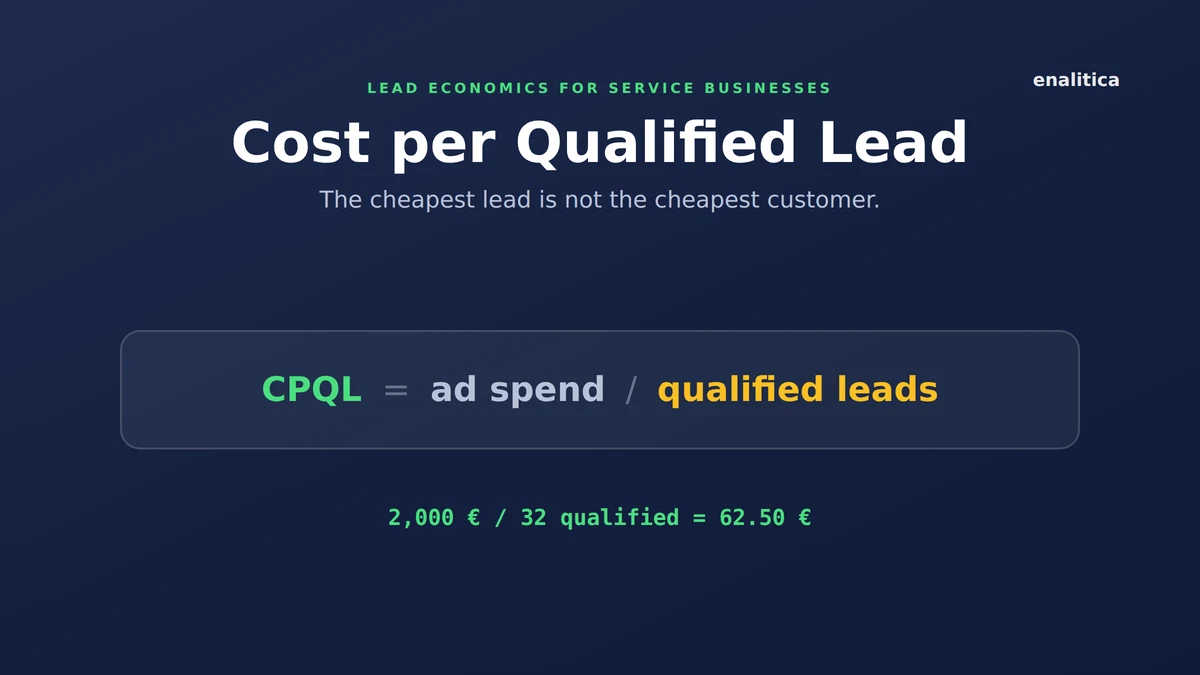
Cost per qualified lead is the number that should decide where a service business spends its ad budget, and almost nobody computes it. Most owners stop at cost per lead, which is exactly one division too early: it prices the inquiry, not the buyer behind it. The channel with the cheapest leads is regularly the one with the most expensive customers.
This guide walks the whole chain with worked numbers: what qualifies a lead, the CPQL formula, your break-even cost per lead computed from your own close rate and deal value, and how the estimate turns into fact once graded leads and CRM data flow back in.
The cheapest lead is not the cheapest customer. Cost per lead prices the inquiry; cost per qualified lead prices the buyer.
Why cost per lead (CPL) misleads budget decisions
Cost per lead divides ad spend by every inquiry that arrives, and that is its flaw: it treats a price-shopper, a job applicant and a ready buyer as the same event. A channel can win on CPL simply by attracting people who were never going to buy.
The pattern repeats across service accounts: one channel delivers many cheap inquiries, another delivers fewer and pricier ones, and the expensive channel quietly closes more jobs. Judged on CPL, the budget flows to the wrong place month after month.
The fix is one more division. Count only the inquiries your team would actually pursue, and the ranking of channels often flips outright.
What counts as a qualified lead?
A qualified lead is an inquiry a salesperson would spend time on: the right service, a real budget, your service area, a reachable person. Marketing language distinguishes MQL (someone raised a hand) from SQL (a human looked and judged it worth pursuing); for a service business the practical definition is the second one.
The definition matters more than the label. Pick criteria you would defend in front of whoever answers the phone, write them down, and apply them to every inquiry. A qualified share that nobody agrees on produces a CPQL that nobody trusts.
In practice the grading is one click per lead: qualified or not, later won or lost. Ten seconds per inquiry is the entire cost of turning a guess into a measurement.
Cost per qualified lead: the CPQL formula with a worked example
Cost per qualified lead divides channel spend by the number of qualified inquiries, not all of them: CPQL = ad spend / qualified leads. One worked example shows why the extra division changes decisions.
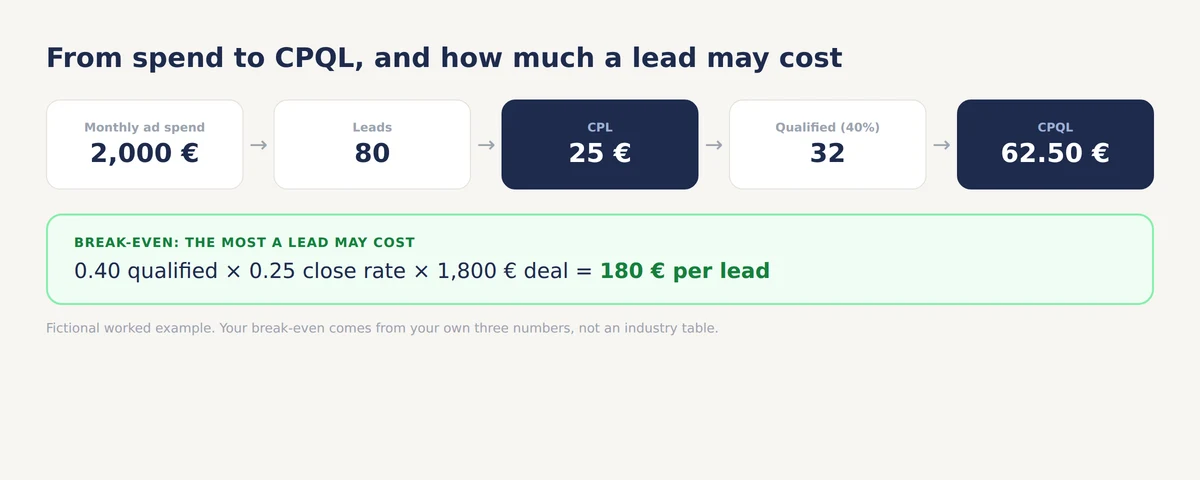
A service business spends 2,000 € a month and receives 80 inquiries: CPL is 25 €. Grading shows 40 percent are qualified, so the same spend bought 32 real prospects: CPQL is 62.50 €. That is the number to compare against what a customer is worth, and the only one worth comparing between channels.
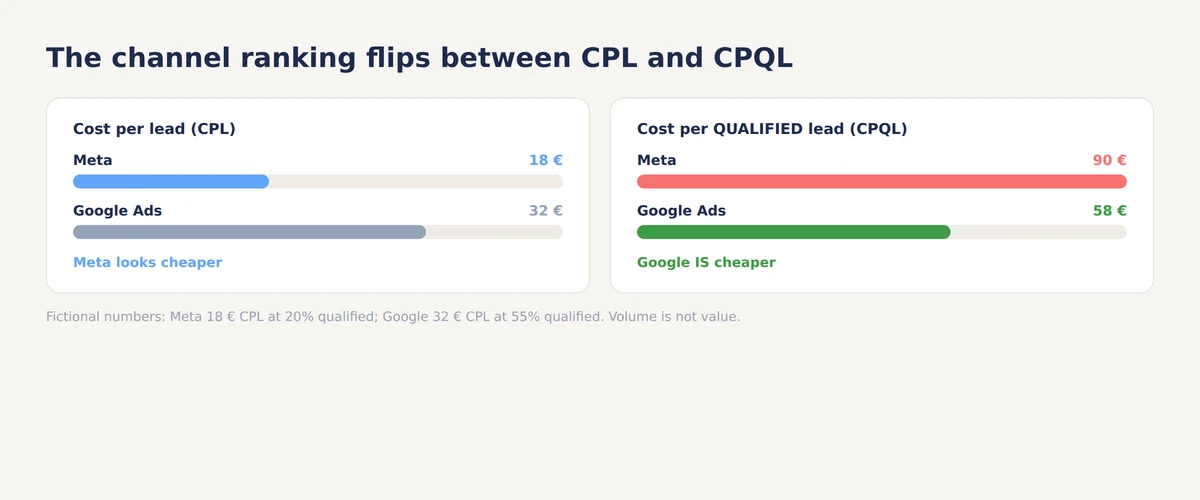
The same arithmetic per channel is where it gets interesting. Meta at 18 € CPL with 20 percent qualified costs 90 € per qualified lead; Google at 32 € CPL with 55 percent qualified costs 58 €. The "expensive" channel is the cheap one.
How much may a lead cost? Your break-even CPL
The most a lead may cost is what a lead is worth, and that is computable from three numbers you already know: the share of inquiries that are qualified, the share of qualified leads you close, and what an average deal is worth. Lead value = qualified share × close rate × average deal value.
With 40 percent qualified, 25 percent of those closing, and an 1,800 € average deal, one incoming lead is worth 0.40 × 0.25 × 1,800 = 180 €. Any channel delivering leads below that is printing money; sustained spending above it needs another justification, such as lifetime value.
Industry benchmark lists publish averages that vary widely by sector and rarely say what they counted as qualified. Treat such numbers as orientation only: your break-even comes from your own three numbers, not from an industry table.
Close rates vary just as widely with the service, the deal size and how strictly you qualify. If you have no history yet, start the calculation at 25 percent as a working assumption and let real gradings correct it.
Run the arithmetic with your own numbers right here; the same tool also lives at a permanent address as a standalone cost per qualified lead calculator.
Cost per qualified lead (CPQL) calculator
Enter five numbers. CPQL = ad spend divided by qualified leads. Lead value tells you the most a lead may cost.
Qualified share and close rate start as estimates. Once you grade leads (qualified, won, lost) and enter deal values, measured numbers replace the assumptions.
Revenue per lead and ROI per channel
Revenue per lead turns the same chain around: instead of asking what a lead costs, it asks what a lead brings, channel by channel. Multiply each channel's qualified leads by close rate and deal value, subtract the channel's spend, and you have ROI in euros rather than in impressions.
This is the view that ends the volume argument. A channel can lose on CPL, win on CPQL, and dominate on ROI, because ROI carries the deal value that inquiry counting ignores. It is also the fairest way to evaluate an agency's work: on returns, not on lead counts.
Budget follows ROI per channel, or it follows whoever argued loudest in the meeting. There is no third option.
From estimate to actual: grading upgrades the math
Every number above starts as an estimate built on your three inputs, and estimates drift. The upgrade path is grading: when leads get marked qualified, won or lost, and won deals get their real value, the calculation stops assuming and starts reporting.
The distinction deserves a visible label. An estimated ROI and a measured ROI look identical in a spreadsheet cell, and treating the first as the second is how bad budget decisions get confident. Keep the two marked apart until enough gradings accumulate.
The practical rhythm is light: grade inquiries as they come, enter deal values when jobs close, and once a month read the per-channel table as fact instead of forecast.
What happens if you close 5 percent more?
A what-if dial answers questions that monthly reports cannot: what happens to per-channel ROI if the close rate rises five points, if the average deal grows, or if a channel's budget doubles. The formula chain makes every scenario instant arithmetic, not a quarter-long experiment.
Two scenarios are worth running for every service business. First, close rate: improving from 25 to 30 percent raises the value of every lead by a fifth, which frequently beats any achievable CPL reduction. Second, spend: doubling a winning channel's budget rarely doubles its qualified leads, so model the decay before committing.
The point of simulation is not precision. It is knowing which of the three numbers moves your profit most, and pointing effort there instead of everywhere.
Closing the loop with your CRM
The full loop closes when deal outcomes flow back automatically: the CRM records a won deal and its value, the value lands on the lead, and the lead carries the ad click that created it. Google documents the same pattern for offline conversion imports: the click ID is saved with the lead and sent back when the sale closes. From that moment the per-channel table updates itself, and "which campaigns are the most profitable, and how much revenue do they bring" becomes a report, not a project.
For businesses running their pipeline in a CRM, a custom connection does exactly this: outcomes and deal values sync in, attribution flows through, and nobody types numbers twice. Where no CRM exists, one-click grading carries the loop; the CRM merely removes the clicking.
Either way the direction is the same: every euro of ad spend traced through inquiry, qualification and closed deal, back to the campaign that started it.
Capture every lead first, with consent handled per country
CPQL is only as good as the lead capture underneath it: an inquiry that never gets recorded, or arrives without its source, silently corrupts every division above. Forms, calls and emails need capturing server-side, each with the click that brought the visitor; the mechanics are in our lead source tracking guide.
In Enalitica's data, last 90 days to 28 September 2026 (nearly 8,000 leads), organic search brought 34% of leads, Google Ads 27%, direct visits 23% and Meta Ads 12%. Only 26% of leads carried a Google click ID and 12.7% a Meta click ID, which is why per-channel CPQL has to start from the lead record, not from what each ad platform reports about itself.
Consent belongs in the design rather than bolted on. The rules differ by market: in the EU, the Court of Justice ruled in Planet49 that storing cookies requires the visitor's active consent, while US state laws such as California's CCPA work on an opt-out basis. Capture should follow the visitor's market, stricter where the law is stricter, complete where the law allows.
And once a lead is captured, speed does more than most optimizations: response time is its own lever, covered in lead response time.
How Enalitica computes CPQL and ROI per channel
Enalitica ships this whole chain as a live table called lead value by source, with a what-if simulator on top. Three dials hold your numbers: qualified share, close rate and average deal value. The table instantly shows leads, qualified count, CPL, CPQL, value and ROI for every channel, and paid channels expand into campaigns with their real ad spend.
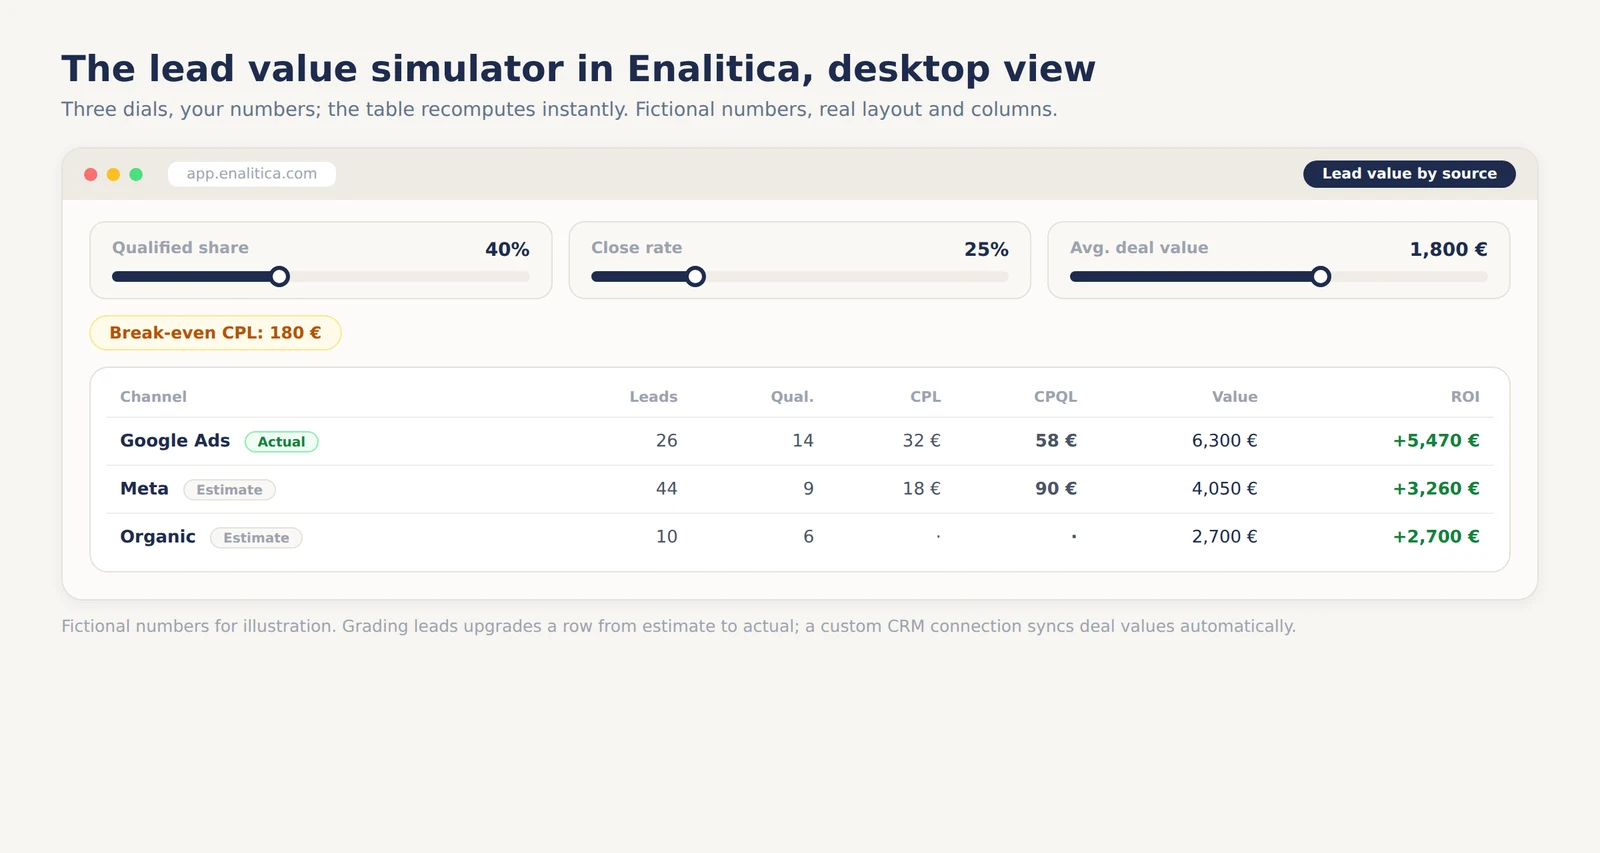
The simulator lives on the service reports view; the service attribution page shows the whole surface. Three design choices carry the honesty. The break-even cost per lead is computed from your dials and shown, so "how much may a lead cost" has a number. An Estimate / Actual badge tells you whether a row still runs on dial assumptions or on graded, real outcomes. And grading upgrades rows automatically: mark leads as won and enter deal values, and the estimate retires itself.
For pipelines living in a CRM, a custom connection closes the loop end to end: deal outcomes and values sync in automatically, so the table shows which campaigns and channels are genuinely the most profitable, and how much revenue each brings, without anyone maintaining a spreadsheet.
CPQL checklist before the next budget shift
- [ ] A written definition of "qualified" your sales side agrees with
- [ ] Every inquiry captured with its source: forms, calls, emails
- [ ] Consent handled per market: opt-in in the EU, opt-out in the US
- [ ] CPL and CPQL computed per channel, never blended
- [ ] Break-even CPL derived from qualified share × close rate × deal value
- [ ] Estimated and actual numbers visibly separated
- [ ] Leads graded weekly; deal values entered on won jobs
- [ ] Budget shifts justified by ROI per channel, not by lead counts
Frequently Asked Questions
What is cost per qualified lead (CPQL)?
Cost per qualified lead is ad spend divided by the number of inquiries worth pursuing, rather than all inquiries. It prices the prospect instead of the form submission, which is why channel rankings frequently flip when you switch from CPL to CPQL.
What is the difference between CPL and CPQL?
CPL divides spend by every lead; CPQL divides spend by qualified leads only. A channel attracting price-shoppers can look cheap on CPL and expensive on CPQL, and the second number is the one connected to revenue.
How do I calculate the value of a lead?
Multiply the qualified share by the close rate and by the average deal value. With 40 percent qualified, 25 percent closing and 1,800 € per deal, one lead is worth 180 €, which is also the most a lead may cost you at break-even.
What close rate is realistic for a service business?
It varies widely with the service, the deal size and how strictly leads are qualified, so published averages are a weak guide. Start the calculation at 25 percent as a working assumption if you lack history, and let graded outcomes replace it as they accumulate.
Do I need a CRM to measure cost per qualified lead?
No. Grading each lead as qualified, won or lost, one click per inquiry, carries the entire calculation. A CRM connection automates the same loop, syncing deal outcomes and values so the numbers update without manual entry.
How much should a lead cost?
At most what a lead is worth: qualified share × close rate × average deal value. Published industry averages span widely by sector and define qualified differently; the only number that decides your budget safely is the break-even computed from your own inputs.
What is the difference between cost per MQL and cost per qualified lead?
Cost per MQL prices a marketing-qualified lead, an enquiry that matched a rule such as a form field or a lead score, while cost per qualified lead prices an enquiry a person has actually judged worth pursuing. For a service business the two collapse into one number when the owner or salesperson grades each lead, which is the loop Enalitica uses: one click marks the lead as qualified, won or lost, and CPQL updates from the grade rather than from a score. Track cost per MQL only if you have a real scoring model; otherwise it is CPL with a nicer name.
Sources
The outside pages this article relies on. Links checked on 28 September 2026.
- offline conversion imports (support.google.com)
- storing cookies requires the visitor's active consent (curia.europa.eu)
- opt-out basis (oag.ca.gov)
Figures marked "in Enalitica's data" are aggregates from the real orders of the stores we measure, with no names and no individual orders. How we measure.
See your real numbers
Import 30 days of orders or leads during a 5-minute onboarding. Works for e-commerce and service businesses.
See plans and pricing