Attribution for service businesses
Do you know which of your ads
brought real customers?
Want to find out? Every form, call and email arrives with the ad that sent it. Grade which enquiries were real, and ask which channel brings customers, not tire-kickers.
Set up in minutes. Your data stays yours.




Ask a simple question. Get a straight answer.
Once your site is connected, you ask ChatGPT, Claude, Gemini or Grok in your own words and it answers from your real enquiries, in plain language. The detailed tables below stay for your team.
Your agency or marketer gets the same numbers as tables, per campaign and keyword, with what Google claims next to them. See below
Read-only. No contact details leave your account. Part of the Growth plan and higher.
How the connection works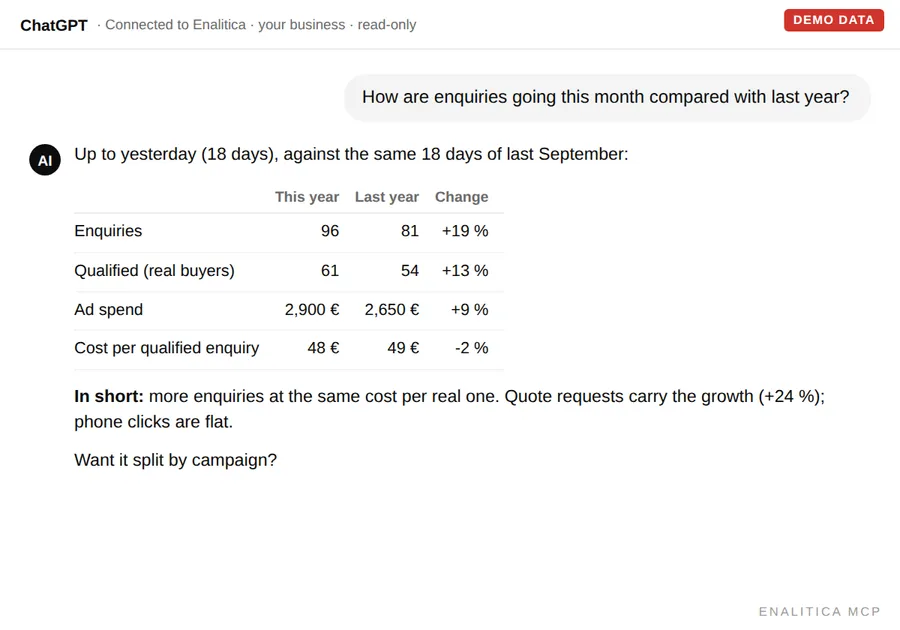
Demo numbers, real questions. On your connection the same questions run on your data.
Every lead captured server-side, none lost to ad blockers.
Form submissions, phone clicks, email inquiries and downloads, all captured server-side with source, campaign and keyword. No ad-blocker or consent-banner gaps.
Grade quality inline. Find the channel that brings buyers.
Mark every lead new, qualified, converted or lost. Add notes, export to CSV, and see which channel delivers paying customers, not just inquiries.
Real cost per qualified lead. Per channel.
Compare Google Ads, Meta, LinkedIn and organic on cost per qualified lead, not cost per click. The metric that actually pays your bills.
Enter revenue per deal and close rate. ROI per channel computes itself.
Three dials, your numbers: what a closed deal is worth, what share of inquiries you close, and what share is qualified. The table instantly shows value, cost per qualified lead and ROI for every channel, and campaigns expand with their real ad spend. Grade leads as won and the estimate upgrades itself to actual, marked as such.
See where visitors drop off, step by step.
Define your path once, plain URLs, one funnel per configurator or booking flow, and the report shows how many people reach each step, how many remain from the start, and where the drop happens. The last step can count real submitted forms instead of page views, and every step opens by channel.
See which companies respond to your LinkedIn ads.
Engaged companies, target-account coverage, and matching against the companies that actually became customers. Numbers are shown as LinkedIn provides them, aggregated and approximate, never "who clicked". For B2B services this is the difference between spending on reach and spending on the accounts you want.
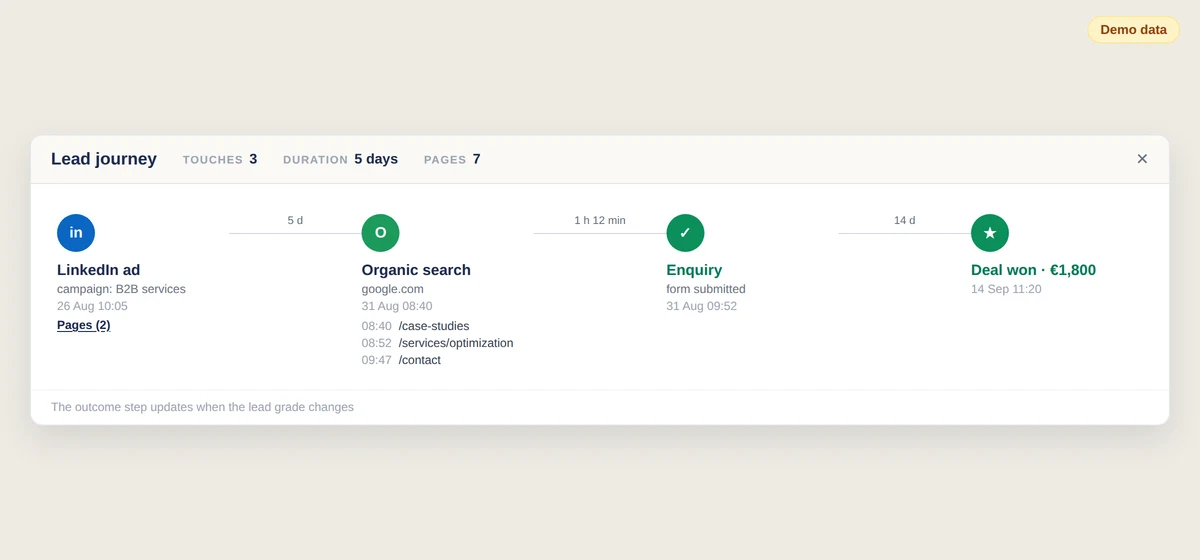
One timeline per enquiry, first click to deal
A report that says Google Ads brought 41 enquiries answers how much, and says nothing about how any single one happened. Open any enquiry and the path unfolds: the first measured touch with its click ID, every session with the pages read in it, the days between them, and the enquiry at the end, with the deal it later became.
What a journey showsEvery lead is a real inquiry, traced to a real ad.
Pixel tools estimate conversions from the aggregate numbers GA4 and Meta report. Enalitica captures the actual inquiry server-side and matches it to the click that sent it, so the channel you scale is the one that truly brings customers.
What our customers say
Tilen! I just wanted to tell you this. Today I created the monthly report for May, and your tool really is incredibly useful. You know we have attribution challenges and always will, given the specifics of our industry and the long buying paths. But having a report that attributes each channel (what Google says, what is direct, and what is influenced) genuinely gives a much more complete and reliable picture.

SEO always gets undervalued because analytics only credits the last click. Enalitica shows us the full picture. One month organic was worth 41% more once assisted enquiries were counted. Organic also played a part in nearly 60% of the assisted revenue credited to Google Ads. Now I can finally prove what SEO really brings.

Frequently asked questions
How does lead attribution for service businesses work?
Every form submission, call and email is captured server-side and matched to the ad click that brought the visitor, so each inquiry arrives with its channel, campaign and keyword already attached.
Can I track phone calls and emails, not just forms?
Yes. Calls and emails are captured alongside forms, so quote requests that skip your form still count and still carry the ad that produced them.
How does lead quality grading work?
You mark each lead as qualified or not, directly in the lead table. Reports then show cost per qualified lead per channel, so budget follows the channels that bring buyers, not tire-kickers.
Do ad blockers break lead tracking?
No. Capture happens server-side rather than in a browser pixel, so ad blockers and Safari’s tracking prevention do not cut the link between an inquiry and the ad that sent it.
Can I see return on investment per channel, not just cost?
Yes. Enter the deal value when a lead is won and every channel shows what its inquiries cost and how much business they returned, so budget decisions rest on returns instead of inquiry counts.
Can I see where visitors drop off in a configurator or booking flow?
Yes. The page funnel lets you define steps by URL, one funnel per flow, and shows people, share remaining and drop-off per step, with the last step optionally counting real submitted forms. Available on the Growth plan.
Does Enalitica show which companies engage with LinkedIn ads?
Yes. LinkedIn B2B insights list engaged companies, target-account coverage and matching against won customers, using LinkedIn aggregated company data. Available on the Growth plan.
How much does Enalitica cost?
The plans and what each one includes are on the pricing page, so you can pick the one that matches what you need.
See which ads bring real customers.
Import 30 days of leads during a 5-minute setup. Your data stays yours.
See plans and pricing