
Ecommerce Growth Plateau: Why Your Store Is Stuck
An ecommerce growth plateau has a math behind it: churn eats new customers, marginal ROAS decays. Four signals in your orders show your ceiling and how to raise it.

Tilen Ledic
Written by
The store did €38,000 in March. €41,000 in April. €37,000 in May. Two years ago the numbers looked the same. Ads are running, campaigns get optimized, everyone is busy, and revenue keeps orbiting the same figure. An ecommerce growth plateau rarely announces itself; it disguises itself as a normal month, twenty-four times in a row.
The frustrating part is that every dashboard looks fine in isolation. ROAS is acceptable. Traffic is stable. The plateau is not visible in any single metric, because it is not a marketing problem. It is an equation: growth stops when new customers only replace the ones you quietly lose, and when the next advertising euro brings back less than it costs. Both halves of that equation are measurable in your own orders.
This guide walks through the math of why stores stall, the four order-level signals that reveal a growth ceiling, and the three levers that actually move it. Budget, you will notice, is not one of them.
Why an Ecommerce Growth Plateau Happens
An ecommerce growth plateau happens when two curves cross: the leaky bucket (customers churning out as fast as new ones arrive) and diminishing returns on ad spend (each extra euro buying less profitable orders than the last). Most stores hit both at similar revenue levels, which is why the plateau feels like a wall rather than a slope.
Neither curve shows up in a weekly ROAS check. Blended ROAS can sit at a healthy 3.5x for two flat years, because it averages the profitable core spend with the unprofitable expansion spend, and because it says nothing about whether the buyers are new. The diagnosis needs different numbers, and all of them live in your order history.
The leaky bucket: new customers only replace lost ones
Every customer base leaks. In ecommerce the leak is severe: the average repeat purchase rate across industries is around 28%, which means roughly seven of ten first-time buyers never return. After a first purchase, the chance a customer comes back is about 27%; only after the second purchase does it jump past 50%.
Run the numbers on a typical store: 10,000 active customers, of whom 70% will not buy again next year. To merely stay flat, acquisition has to deliver 7,000 new customers a year, about 580 a month. Every new customer up to 580 is replacement, not growth. Customer number 581 is the first one that grows the business. A store acquiring 600 new customers a month at rising cost feels like it is growing; it is treading water with 3% real growth.
| Monthly new customers | Customers replaced | Real growth |
|---|---|---|
| 400 | 580 needed | Shrinking |
| 580 | 580 | Zero, the plateau |
| 700 | 580 | +120/month growing |
That is why acquisition-only growth gets more expensive every year while producing the same revenue: the bucket got bigger, so the leak got bigger, so replacement now consumes what used to be growth. The leaky bucket pattern is the single most common structure behind a multi-year plateau.
Diminishing returns: when the next ad euro stops paying
Ad platforms sell your best audience first. The first slice of monthly spend reaches the highest-intent buyers; every increment after that reaches progressively less interested people at progressively higher cost. The result is that marginal ROAS (the return on the last €100 you added) decays long before blended ROAS shows any problem. A channel can report a 4x average while the marginal euro returns well under break-even.
The environment makes the slope steeper every year: CPCs are inflating 10 to 25% annually and average ecommerce ROAS fell to about 2.9 in 2025. A useful field rule: when incremental spend on your main channel yields less than about 70% of your blended ROAS, the next euro belongs somewhere else, in another channel, another market, or another lever entirely.
This is why "raise the budget" so rarely breaks a plateau. Budget scales spend along the same decaying curve. If the ceiling is made of churn and saturation, more fuel just burns hotter at the same altitude.
Which numbers reveal a growth ceiling?
Four signals, all computable from your orders and ad spend, reveal a growth ceiling: a falling new-customer share of revenue, aMER far below MER, CAC pressing against your allowable CAC, and a customer value curve that flattens after month three. One of them alone is a warning; all four together are a ceiling.
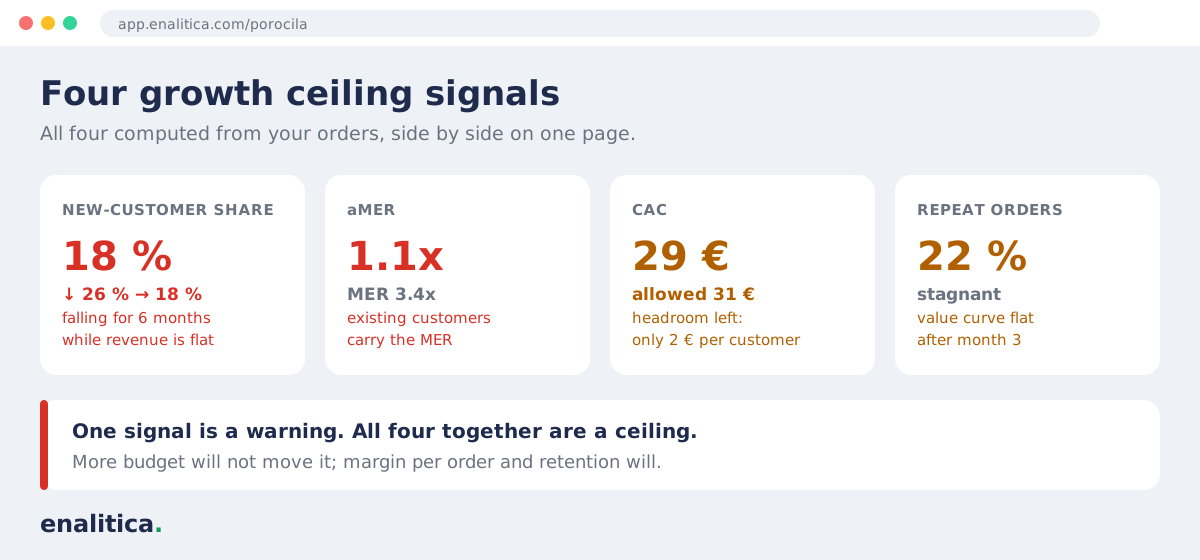
- New-customer share of revenue keeps falling. When a rising share of this month's revenue comes from returning buyers while total revenue stays flat, acquisition has stalled and the base is coasting. Comfortable in the short run, fatal over two years, because the leak never stops.
- aMER sits far below MER. MER divides all revenue by all marketing spend; aMER divides only NEW-customer revenue by the same spend. When MER reads 3.4x and aMER reads 1.1x, existing customers are carrying the headline number and your marketing is mostly buying back people you already own.
- CAC has no headroom left. Your allowable CAC is not a benchmark; it is computed from your own cohorts: how much profit a new customer returns by month 3 or 6. When actual CAC creeps to within a euro or two of that ceiling, scaling spend buys growth that arrives pre-spent.
- The value curve flattens at month three. If profit per customer by cohort stops growing after M3, you are financing acquisition from first orders only, which caps what you can afford to pay, which caps how fast you can grow.
How do you raise your ecommerce growth ceiling?
Raising a growth ceiling means changing one of three inputs: margin per order, customer retention, or the size of the demand pool you fish in. Each one feeds directly back into how much you can afford to pay for the next customer, which is the actual throttle on growth.
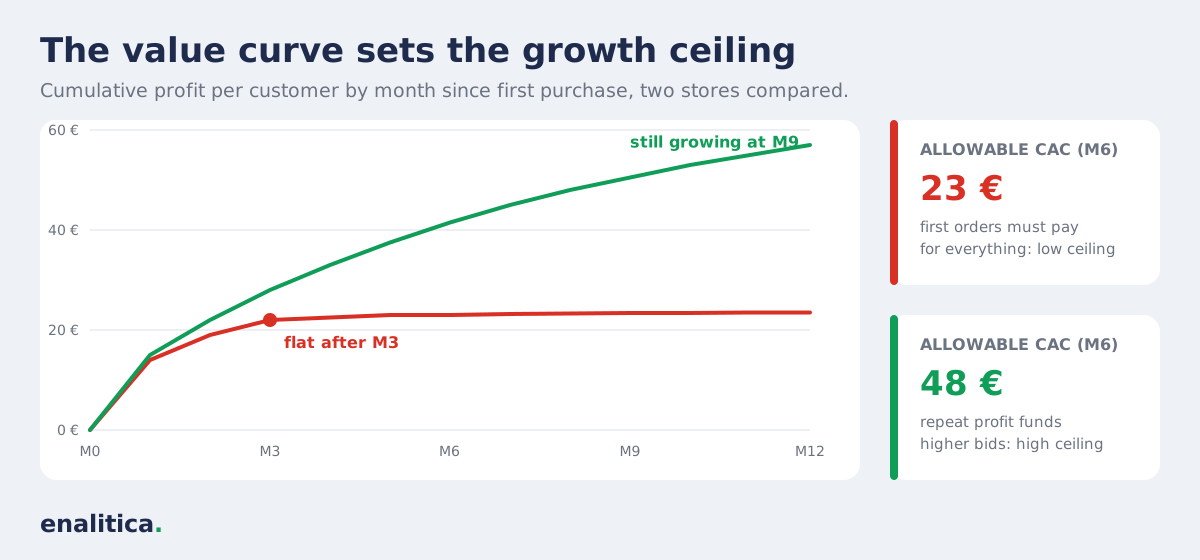
- Margin: earn more per order. Higher AOV (bundles, thresholds for free shipping), better purchase prices, fewer blanket discounts. Every euro of extra contribution per order raises your allowable CAC by the same euro, and suddenly bids that were losers become winners. This is the fastest lever because it needs no new customers at all; start by knowing your profit per order, not just revenue.
- Retention: shrink the leak. Moving repeat rate from 22% to 30% does two things at once: it adds revenue that costs nearly nothing to collect, and it lifts the whole cohort curve, which again raises allowable CAC. The highest-leverage moment is the second purchase; once a buyer purchases twice, the odds of a third pass 50%. Post-purchase email flows and a reason to return in the first 60 days beat any loyalty-point scheme.
- New demand pools: when the old one is fished out. If marginal ROAS on your main channel is deeply degraded, the answer is not more of the same audience, it is a different one: a second channel, an adjacent country, a new category. Expansion is the most expensive lever, which is why it comes third; expanding with a leaky bucket and thin margins just builds a bigger leaky bucket.
The order matters. Margin first (weeks, no new customers needed), retention second (months, compounding), expansion third (quarters, capital). Most stuck stores attempt them in exactly the reverse order.
How Enalitica shows your growth ceiling in one view
Enalitica computes all four ceiling signals from your orders, on the same Summary page. The aMER tile sits next to MER and warns you outright when existing customers carry the number. The New customers tile tracks how many buyers this month are genuinely new (matched on hashed customer email, not guesswork) and what share of revenue they brought.
One level deeper, the cohort card draws profit per customer month by month for every acquisition cohort, computes your allowable CAC from the curve you actually have (not an industry benchmark), and shows the headroom between what a new customer may cost and what you currently pay. When that headroom reads two euros, you have found your ceiling; when the levers above move margin or retention, you watch the ceiling move in the same card.
Every number in this guide (new-customer share, aMER, allowable CAC, the cohort curves) is something Enalitica calculates automatically from the orders your shop already records: no spreadsheet, no setup, no analyst on retainer. You connect the store, the four signals appear. Book a demo and we will read yours together, and tell you honestly which lever is the cheap one in your case.
Frequently Asked Questions
What is a growth ceiling in ecommerce?
A growth ceiling is the revenue level where new customers only replace churned ones and additional ad spend returns less than it costs, so total revenue stops rising regardless of effort. It is set by three inputs (margin per order, retention rate, and demand pool size), which is why changing budgets or agencies rarely moves it, and changing unit economics does.
Why is my store stuck at the same revenue every month?
Usually because acquisition is exactly offsetting churn. With ecommerce repeat rates averaging around 28%, roughly 70% of a customer base must be replaced yearly just to stay flat. Check the new-customer share of your revenue: if it is drifting down while revenue holds, your marketing is refilling a leaky bucket rather than growing the business.
What share of revenue should come from new customers?
There is no universal target, but the direction and the pairing matter: healthy growth shows a stable or rising new-customer share alongside rising total revenue. A falling share with flat revenue signals stalled acquisition; a very high share (over ~80%) with weak repeat rates signals a leaky bucket that will get expensive. Watch the share monthly next to aMER rather than against a benchmark.
Does increasing the ad budget break a revenue plateau?
Rarely on its own. Extra budget buys the next, less interested audience at a higher CPC, so marginal ROAS decays; if incremental spend returns less than about 70% of your blended ROAS, the additional euro is better spent elsewhere. Budget increases work only after the ceiling itself moves: higher margin per order or better retention first, then spend into the new headroom.
See your real numbers
Import 30 days of orders or leads during a 5-minute onboarding. Works for e-commerce and service businesses.
See plans and pricing