
Customer Acquisition Cost: Find Your Real Ceiling
Customer acquisition cost for ecommerce averages 68 to 84 dollars and keeps climbing. How to compute your allowable CAC from your own cohorts, not benchmarks.

Tilen Ledic
Written by
Customer acquisition cost is the number that decides whether your marketing scales or slowly bleeds you: industry benchmarks put the ecommerce average at 68 to 84 dollars per new customer, up roughly 40 to 60% since 2023, and DTC brands that paid about 24 dollars in 2015 pay around 80 today. Benchmarks make good headlines and bad decisions, though. The question that matters is not "what does everyone pay" but "what is the most YOUR store can afford to pay", and that ceiling can be computed from your own orders.
This guide covers what belongs inside customer acquisition cost, why the famous 3:1 rule came from a different industry, how to derive your allowable CAC and payback period from cohorts, and five counting mistakes that quietly flatter CAC reports.
What customer acquisition cost includes (and what CPA hides)
Customer acquisition cost is all acquisition spending divided by the number of NEW customers it produced. Two words in that sentence do the work. "All" means ad platforms plus the agency fee, the influencers and the tools, not just media spend. "New" means first-ever buyers, which no ad platform actually knows: platform CPA divides spend by conversions, and a conversion is any purchase, including the loyal customer's fifth order.
That is why platform CPA and true CAC can differ by multiples. A campaign harvesting existing customers shows a gorgeous CPA while acquiring almost nobody; the pattern is most extreme on brand campaigns, where most clickers already knew you. Whether a buyer is genuinely new can only be answered by your order history, matched on the customer, not by a pixel.
Why rising acquisition costs changed the math
Acquisition math that worked in 2019 quietly stopped working. Google Ads CPCs climbed about 13% year over year, iOS privacy changes blunted targeting, and marketplace giants inflated auctions across most retail categories. The result: an average ecommerce CAC of 68 to 84 dollars, with most stores sitting somewhere between 50 and 90, and subscription brands reporting higher costs almost across the board.
Rising CAC does not automatically mean stop spending; it means the margin for sloppy counting is gone. When a new customer cost 24 dollars, overpaying by a third was survivable. At 80 dollars, knowing your exact ceiling is the difference between marketing that earns money and marketing that only sells.
Is the 3:1 LTV to CAC rule right for ecommerce?
Mostly no. The 3:1 LTV to CAC target was born in subscription software, where revenue recurs monthly, gross margins run past 80%, and a customer pays back over years. Ecommerce customers buy discretely, margins are a fraction of SaaS margins, and healthy DTC brands routinely operate between 1.5:1 and 3:1 without being in trouble.
Two corrections make the ratio meaningful for a store. First, compute LTV on PROFIT per customer (revenue minus product costs, shipping, fees), not revenue; a revenue LTV overstates the ceiling by exactly your cost ratio. Second, cap the horizon: money a customer might spend in year three does not pay this quarter's ad invoices. Cohort curves of profit per customer give you both corrections at once.
How do you calculate your allowable CAC?
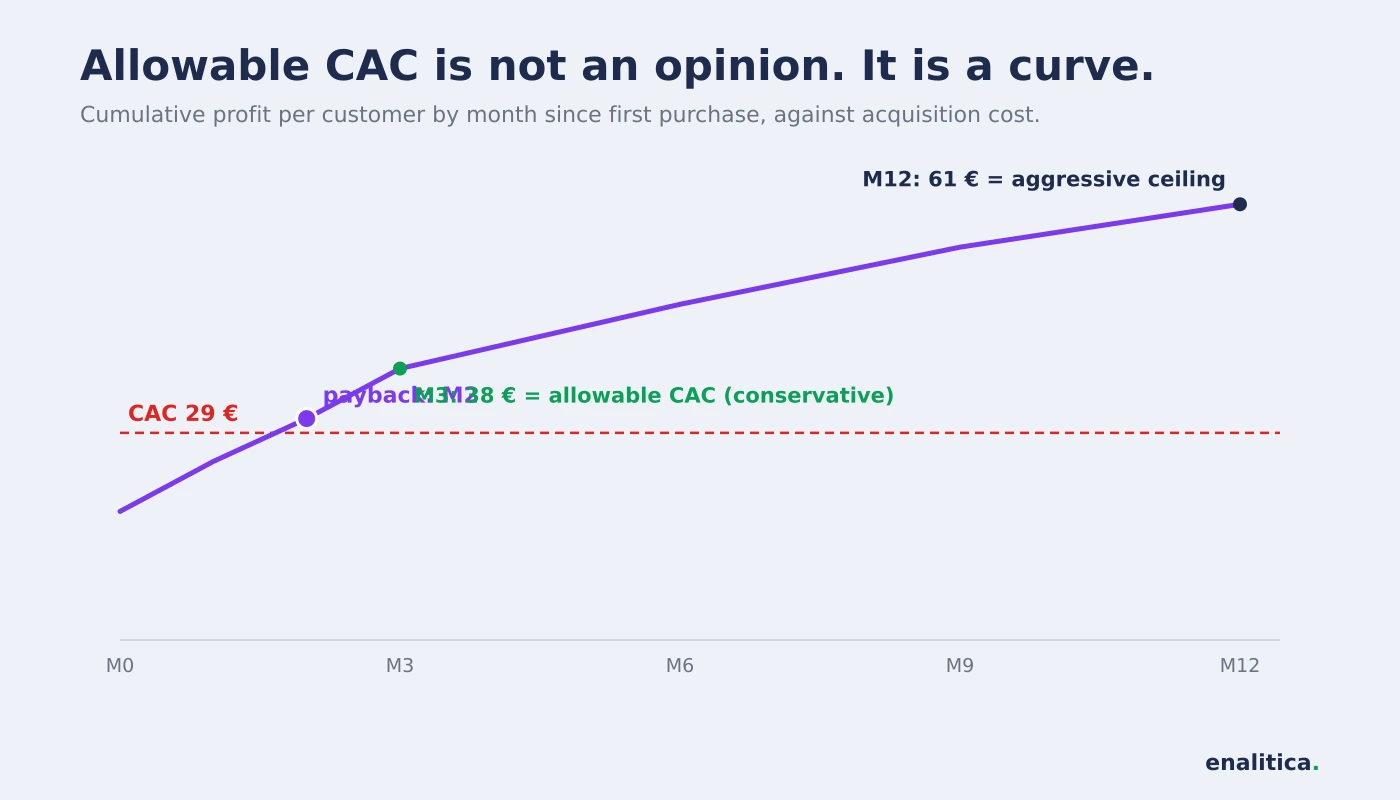
Allowable CAC is the average profit a new customer brings you within your payback window, computed from cohorts that have already lived through that window. Take customers acquired in a given month, sum their profit (all repeat purchases included) through month 3, divide by the number of customers: that is the most you can pay per new customer and be whole in three months. The 12-month reading is your aggressive ceiling.
A worked example: your matured cohorts average 38 euros of profit per customer by M3 and 61 euros by M12. If you currently pay 29 euros per new customer, you have 9 euros of headroom at a conservative target and can outbid competitors who only look at first-order margin. If you pay 45, you are financing growth from cash reserves and should know for how many months.
CAC payback period beats the ratio
Payback period, the number of months until a new customer's cumulative profit covers their acquisition cost, is a cash-flow number, and cash flow is what actually kills stores. A 200-euro CAC that pays back in 3 months is safer than a 50-euro CAC that pays back in 12, because the fast payback lets you recycle the same money four times a year.
Watch the trend more than the level: payback stretching from 2 months to 5 across recent cohorts means acquisition quality is degrading even if the CAC itself looks stable. And treat the SaaS "under 12 months is healthy" line with suspicion; a store financing inventory usually wants first-order or low-single-digit-month payback on most of its cohorts.
Five CAC counting mistakes that flatter reports
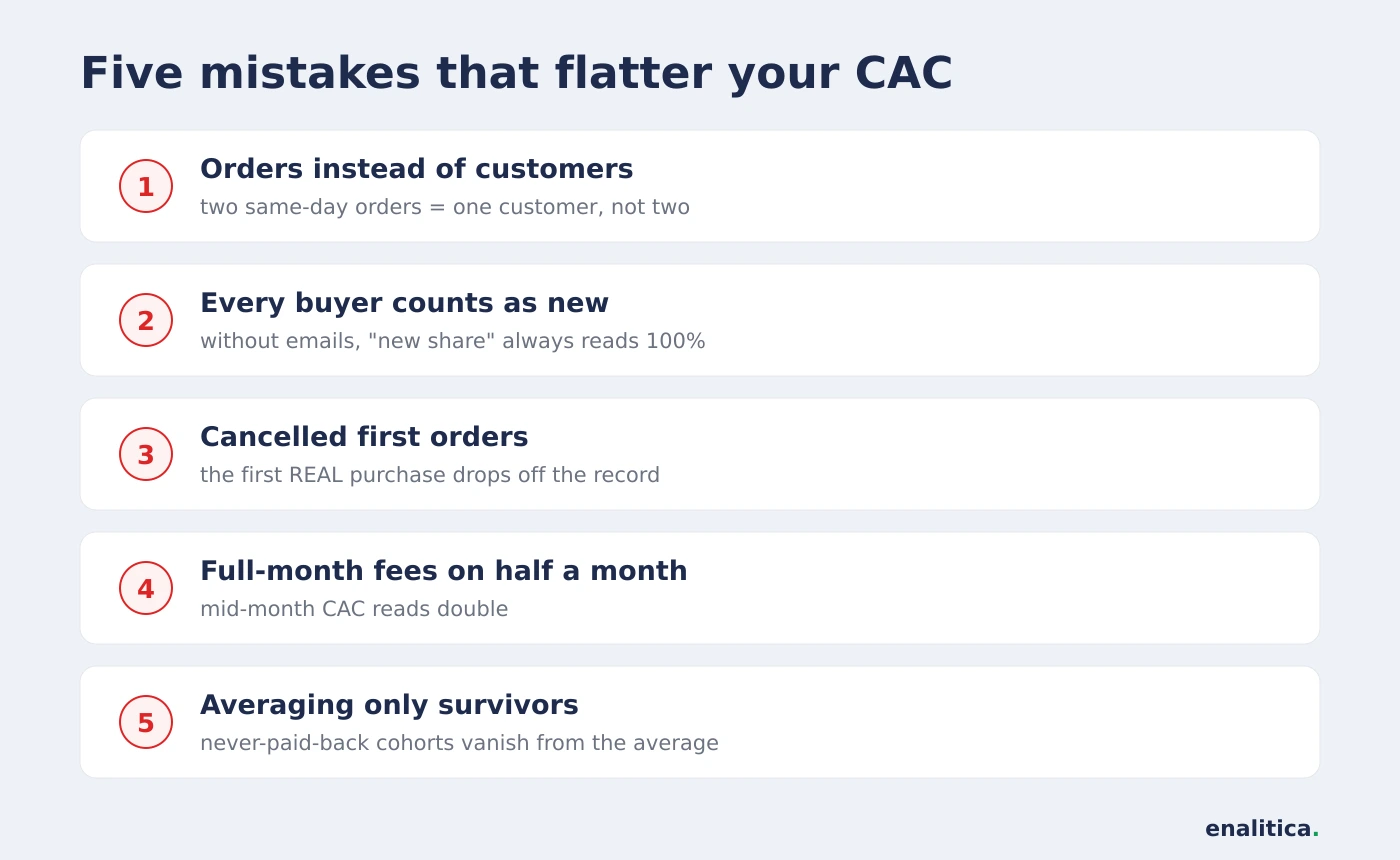
Most CAC numbers are wrong in the store's favor, and the errors compound. These five come from real pipelines, ours included, which is why Enalitica's current CAC engine guards against each one:
- Counting orders instead of customers. One enthusiastic new buyer placing two same-day orders is one customer, not two; dividing by orders understates CAC.
- Counting every buyer as new. Without matching orders to a customer identity (email), every purchase looks like a first purchase, new-customer share reads 100% and CAC looks fabulous. If your report never shows returning buyers, this is why.
- Ignoring cancelled first orders. A customer whose first order failed at payment is still new when they buy for real next month; sloppy joins drop them entirely.
- Charging a full month of agency fees to half a month of customers. Mid-month reads double the true CAC unless monthly costs are prorated by day.
- Averaging only the success stories. A payback average across cohorts that ever paid back, ignoring those that never did, is survivorship bias in a KPI.
How Enalitica computes CAC from your orders
Enalitica detects a new customer from order history: a securely hashed customer email whose first-ever order falls in the month, with cancelled and returned orders excluded from the record. The Summary dashboard shows the cost of a new customer next to aMER and the share of revenue new buyers brought, each with month-over-month deltas, and a coverage chip that tells you what share of orders carried an email. When coverage is too low to be truthful, the tile says so instead of showing fiction.
The cohort card computes the rest of this article automatically: profit per customer by month since first purchase, payback month per cohort, LTV to CAC labeled with the maturity it was measured at, and an allowable-CAC reading that uses only cohorts old enough to have finished the window. An approximate average margin is enough to start; exact purchase prices sharpen the same curves later.
Book a demo and we will compute your allowable CAC from your own cohorts in one call.
Frequently Asked Questions
What is a good customer acquisition cost for an ecommerce store?
There is no universal good CAC: benchmarks put the ecommerce average at 68 to 84 dollars, but a store with 70% repeat rate can pay double what a one-and-done store can. The honest target is your own allowable CAC, the profit a new customer returns within your payback window, computed from matured cohorts.
What is the difference between CAC and CPA?
CPA divides channel spend by conversions, counting every purchase including repeat buyers. CAC divides ALL acquisition spending, agency and tools included, by genuinely NEW customers. Platform CPA is an optimization signal inside one channel; CAC is the unit-economics number a budget decision should stand on.
How can I afford a higher CAC than my competitors?
Repeat purchases raise your allowable CAC: if your customers come back and a competitor's do not, you can profitably outbid them on the same auction. That is why retention work shows up, with a delay, as acquisition advantage, and why allowable CAC should be recomputed as cohorts mature.
Should LTV in the LTV to CAC ratio use revenue or profit?
Profit. A customer who buys 300 euros of goods at a 30% contribution margin is worth 90 euros before marketing, not 300. Revenue-based LTV inflates the ratio by your cost structure and is the most common reason a "3:1" store loses money.
See your real numbers
Import 30 days of orders or leads during a 5-minute onboarding. Works for e-commerce and service businesses.
See plans and pricing