
Customer Lifetime Value, Without the Myths: Cohorts, CAC Payback and What a Customer Is Really Worth
Customer lifetime value is the most misquoted number in e-commerce. How cohort tables work, what real repeat-purchase data says, and what to pay per customer.

Tilen Ledic
Written by
Two customers arrive at your store, each acquired by an ad, each costing you €54. The first buys a €60 accessory and is never seen again. The second buys the same €60 accessory, comes back in September, again in December, and brings €240 of profit within a year.
Their customer lifetime value could hardly differ more, yet your ads dashboard reports both as identical conversions. Same cost, same first order, same ROAS contribution. Every budget decision you make on that dashboard treats those two customers, and the campaigns that found them, as equally valuable. They are not, and the tool for telling them apart has been around for decades: cohort analysis, the honest version of "customer lifetime value."
This post explains how LTV and cohort tables actually work (in plain language, because the tables look scarier than they are), what real repeat-purchase data says instead of the recycled myths, how businesses have used cohorts to make real decisions, and how we built this into Enalitica so the math runs on profit rather than flattering revenue.
What Customer Lifetime Value Measures (and the Revenue Trap)
Customer lifetime value (CLV, usually shortened to LTV in e-commerce) is the answer to one question: how much is a customer worth to you over time, in total? Not their first order. Everything: the first purchase, the repeat in September, the gift order in December, minus the refund in January. Mechanically, three levers drive the number: average order value, purchase frequency, and margin.
The trap is the unit. Most tools and most blog posts compute LTV in revenue, and revenue cannot repay an ad bill. If a customer generates €500 of revenue at a 40% margin, they produced €200 you can actually spend; a customer with €300 of revenue at 70% margin produced €210 and is the more valuable one, even though revenue-LTV ranks them backwards. Computed on revenue, an LTV:CAC ratio of 3.3 can hide a profit ratio of 1.3. Everything in this post, and everything in Enalitica, therefore uses profit-based LTV: revenue without VAT, minus product costs, shipping, payment fees, with refunds subtracted, the same engine as POAS.
Cohort Tables: Each Row Has Its Own Clock
A cohort is simply everyone who bought from you for the first time in the same month. The July cohort, the August cohort, and so on. The cohort table tracks each group's cumulative profit per customer as the months pass.
Here is the part that confuses almost everyone at first: the columns, labeled M0, M1, M2, are not calendar months. They count months since that row's customers first bought. Each row runs on its own clock:
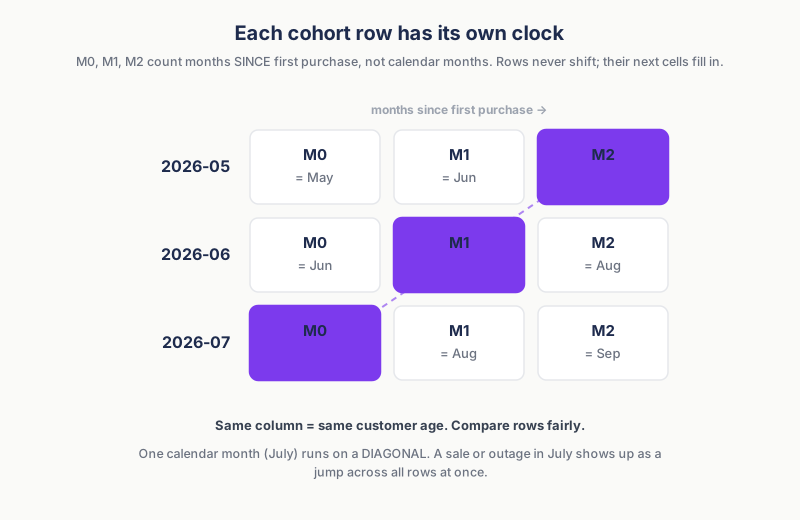
For the 2026-07 row, M0 is July and M1 is August. For the 2026-06 row, M0 is June and M1 is July. When August arrives, the July row does not shift into M1; the July row stays where it is, and its M1 cell fills in with whatever those same customers bought during August. Empty cells with a dot simply have not happened yet.
Why build the table this sideways way? Because it lines every generation of customers up by age. Reading down the M0 column answers "are the customers I acquire getting better or worse in their first month?" without older cohorts winning just because they have had more time. And one elegant side effect: a single calendar month cuts across the table on a diagonal, so a July sale, price change or site outage shows up as a jump across every row at once.
The Three LTV Numbers That Matter: nCPA, Payback Month, LTV:CAC
A good cohort view compresses into three numbers per row.
1. nCPA: what a new customer cost you. Take a month's entire marketing spend (ad platforms plus your agency, tools and influencer costs) and divide by the number of first-time customers that month. Note this is a blended number that deliberately charges all marketing to new customers; repeat buyers ride free, which keeps it conservative.
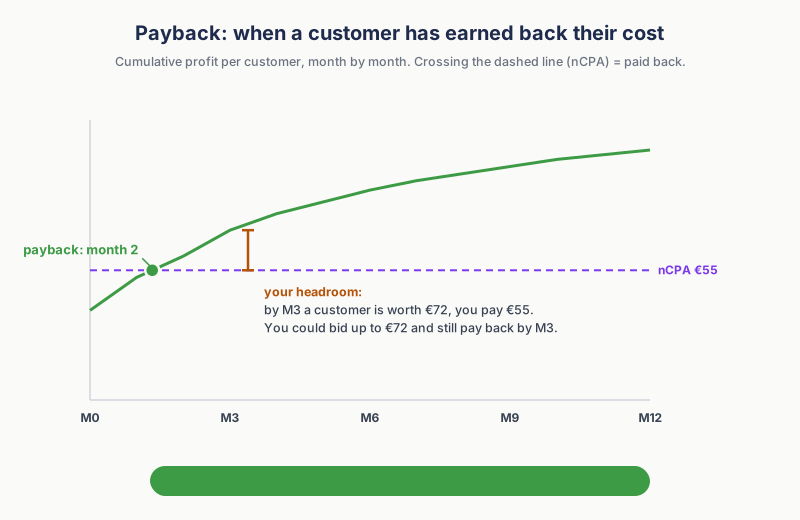
2. Payback month: when the customer has earned their cost back. Follow the row's cumulative profit per customer until it crosses nCPA. Cross at M0 and your customers pay for themselves with the first order, the strongest position in e-commerce. Cross at M4 and you are financing four months of ad spend from cash flow, a payback period that is survivable with a healthy repeat rate and lethal without one.
3. LTV:CAC: the multiple. Cumulative profit per customer divided by nCPA. Below 1.0 the customer never repays their acquisition; above it, every increment is real gain. One honesty rule that most dashboards skip: a cohort that is only three months old can only give you a three-month ratio. Presenting an M3 ratio as "12-month LTV:CAC" flatters young cohorts and is one of the classic ways cohort analysis goes wrong.
Repeat Purchase Rate and CAC Benchmarks Worth Trusting
Benchmarks for repeat purchase rate and customer acquisition cost circulate endlessly online; the research for this post traced most of them to their sources, and the trustworthy residue is smaller than you would expect.
- Repeat rates are lower than the folklore. The most-quoted "average repeat purchase rate of 28%" gets copied from blog to blog, usually without a sample you can check. A more recent dataset of 156,000 DTC customers found 18.8% placed a second order within a year, and among those who did, half did it within 30 days. Consumables (supplements, cosmetics, food) run structurally higher; furniture and durables structurally lower.
- Returning customers punch far above their weight. Adobe's 2012 Digital Index analysis of US retail sites found that returning and repeat purchasers were only 8% of visitors but 41% of online revenue. The often-quoted escalation (a customer who bought twice is far more likely to buy a third time than a first-time buyer is to buy a second) holds directionally in every dataset we could find.
- Acquisition keeps getting more expensive. SimplicityDX estimated in July 2022 that merchants went from losing $9 per newly acquired customer in 2013 to $29. Rising customer acquisition costs are exactly why knowing your customers' downstream value stopped being optional.
Our own numbers sit below even that dataset. In Enalitica's data (nearly 30,000 customers with an order in the 12 months to 28 September 2026), 14.7% of customers placed a second order within 12 months; per store the rate ran from 8% to 21%, with a median of 14%. Repeat orders still made up 23.4% of all orders in the same window, roughly one order in four.
If your repeat rate sits at the low end of that range, the cohort table delivers a blunt verdict.
A low repeat rate does not tell you to "invest in the long game." It tells you the first order must be profitable on its own, because for most customers there is no second one.
That is a POAS conclusion, and it is just as valuable as discovering hidden repeat value, because it stops you from overspending on a promise your data says will not materialize.
Four LTV Myths Worth Retiring
LTV content is the most myth-dense corner of e-commerce writing. Four corrections, each traceable:
"Acquiring a customer costs 5 to 25 times more than retaining one." This exact phrasing comes from a 2014 Harvard Business Review article which cites no study for the range, and researchers who went looking for the original evidence never found one. Customer retention is often cheaper; how much cheaper depends entirely on your business, which is precisely what your own cohort table measures.
"Increasing retention 5% increases profits 25 to 95%." The real source of this retention-rate claim is Reichheld and Sasser's 1990 work on banks and insurance brokers, single-company case results from 1980s service industries. Fine research, wrong universe to quote as an e-commerce law.
"A healthy LTV:CAC is 3x." The 3x rule was written by David Skok for SaaS companies: recurring multi-year contracts at 75-85% gross margins. E-commerce is transactional with far lower margins and a repeat curve that mostly plays out inside 12 months. The honest e-commerce floor is simpler: below 1.0 on profit-based LTV you are losing money on every customer; how far above 1.0 you need to be depends on your fixed costs, not on a SaaS benchmark.
"My analytics already shows retention." GA4's cohort report keys on the device, not the person: Google's documentation states that cohorts are based on the user's device data only and that User-ID is not considered. A returning customer on a new phone, a cleared cookie, or a different browser enters the table as a brand-new user. Order-based cohorts keyed on the actual customer identity routinely show repeat rates dramatically higher than GA4 reports, which is the same pixels-versus-orders gap that distorts attribution.
What Cohort Analysis Changes in Practice
Two documented stories, and one pattern you can test on your own data, show the kinds of decisions this table drives.
Killing the discounts that killed the margin. When Drew Sanocki's team took over the bankrupt streetwear retailer Karmaloop, segmentation showed a tiny "whale" segment (customers with two orders in 90 days, about 1% of sessions driving 43% of revenue), while blanket email promotions had attracted cohorts that only buy on promotion. The fix was to stop giving margin to people who would have bought anyway: win-back discounts started only after a customer had gone quiet for 60 days, and at 10%. Karmaloop went from bankruptcy in July 2015 to a sale in March 2016. What discounts do to profit inside a single week is broken down in our guide to Black Friday ads.
Raising spend because 60-day LTV said so. Common Thread Collective's brand Bambu Earth could not acquire customers profitably at its conversion rate and order value. The lever that worked was not cheaper ads but higher customer value: a full-funnel approach built around a skin quiz and personalised email sequences lifted 60-day LTV by 49%, which raised how much they could afford to pay per customer, which unlocked profitable scaling.
Discovering which first product creates the best customers. Split your cohorts by the product in the first order and the curves often separate: one entry product brings customers who come back, another brings customers who never do. The first product a customer buys is an acquisition channel in disguise.
That last pattern is why discount analysis belongs in the cohort table too:
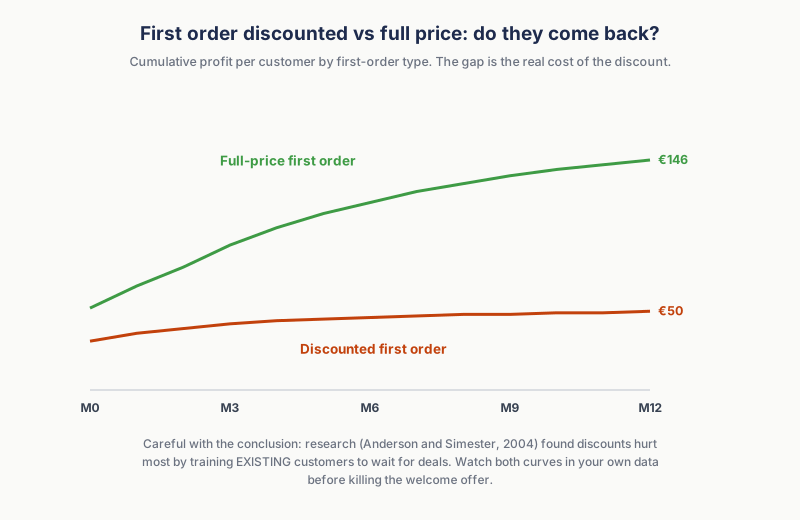
One research-backed nuance before you kill your welcome offer: a field study by Anderson and Simester found discounts increased future purchases by brand-new customers while decreasing them among established customers, who learn to wait for deals.
The danger of a welcome discount is not the intro offer itself; it is training your loyal customers to wait for the next deal.
Your own two curves will tell you which effect dominates.
Allowable CAC: What You Can Afford to Pay per Customer
"Ultimately, the business that can spend the most to acquire a customer wins." (Dan Kennedy)
Direct-response marketers have repeated Dan Kennedy's line for decades. It sounds reckless until you see what makes it safe: you can only outspend competitors when you know what a customer is worth to you, and they are guessing.
The cohort table turns the slogan into arithmetic. If your matured cohorts show a customer is worth €72 of profit by month three, and you are acquiring at €54, then €72 is your allowable CAC at a 3-month payback target, and the €18 gap is your scaling headroom: the auctions you can win, the audiences you can afford to test, while competitors who only see first-order ROAS must stop bidding. If the numbers run the other way (nCPA above your M3 value), the same table is an early-warning system telling you the payback period is drifting out and cash flow will feel it.
How Enalitica Builds Profit-Based LTV Cohorts
We built the cohort view into the profit dashboard rather than as a separate module, because LTV inherits every cost decision the profit engine already makes. A few choices worth explaining:
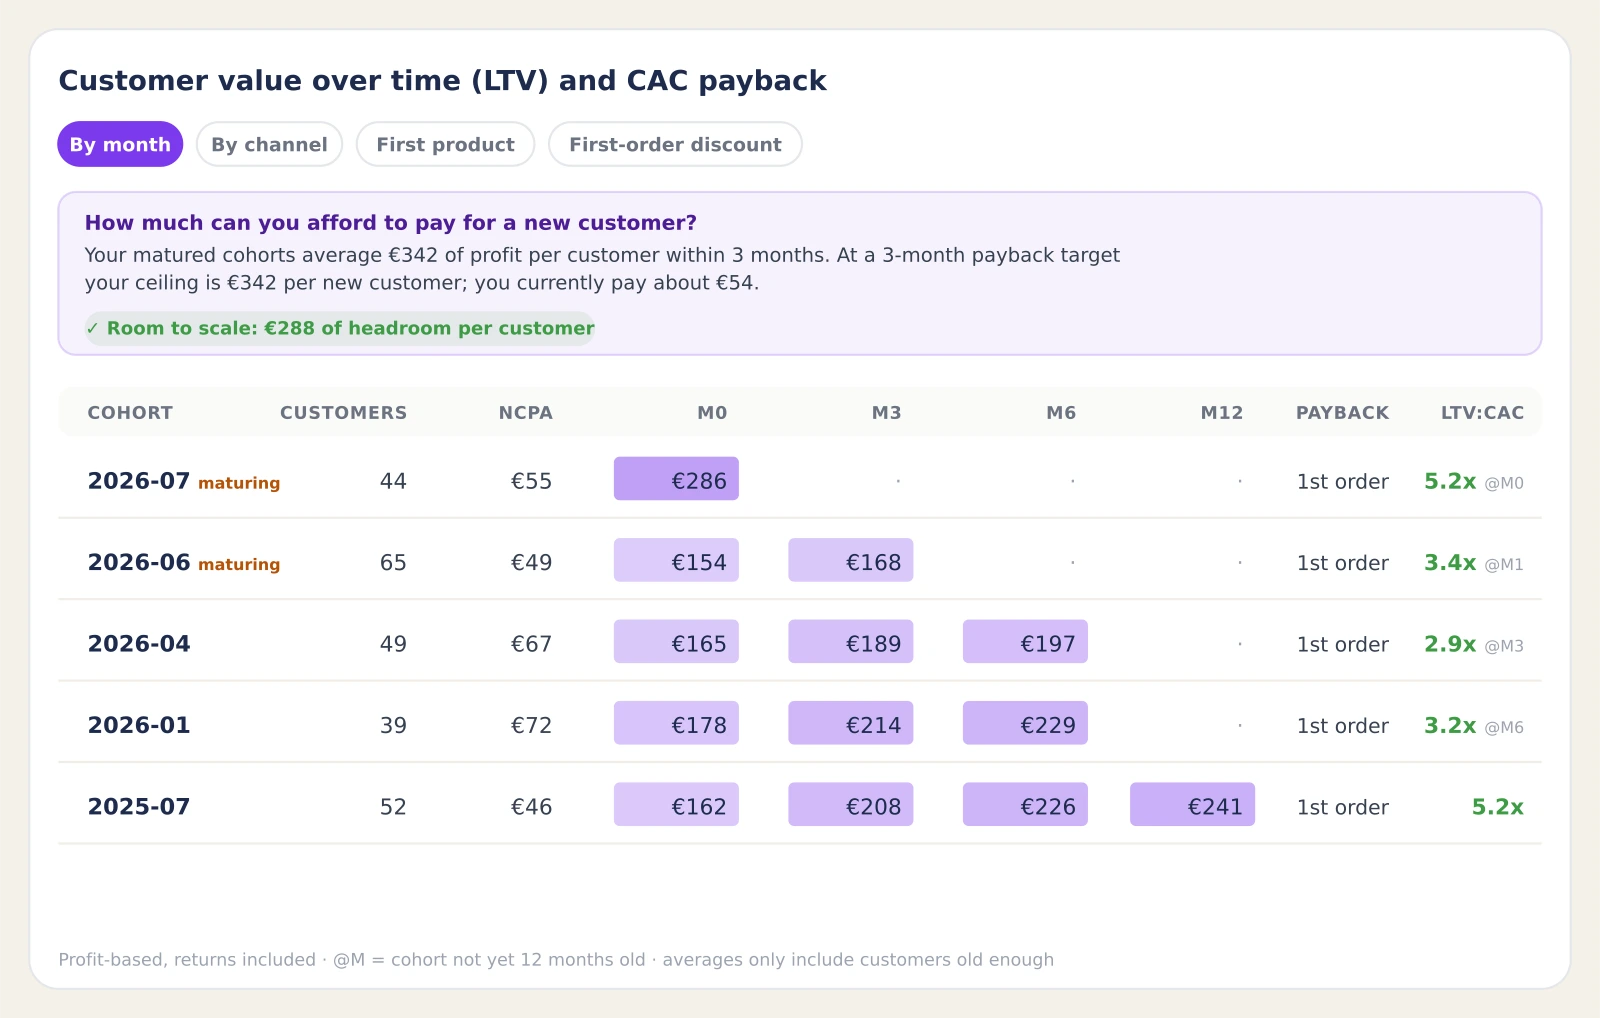
Profit, not revenue. Every cell is cumulative contribution profit per customer: revenue without VAT, minus product costs, shipping, payment fees, with refunds subtracted. Of the LTV tools we surveyed while researching this post, nearly all compute cohort LTV on revenue. A revenue toggle exists, mostly so you can see how much the flattering version overstates.
Honest maturity, no projections. Averages at month M only include customers old enough to have reached month M, young cohorts are labeled "maturing", and any ratio measured before twelve months carries a visible tag (like 2.9x @M3) instead of impersonating a 12-month figure. We also deliberately ship no predicted LTV: prediction models in this category publish no accuracy numbers, and practitioners report they routinely overestimate. We would rather show you a real number with a maturity label than a guess with confidence.
Four ways to slice the same customers. By acquisition month (is customer quality trending up or down), by the channel that brought the first order (which channel acquires customers who come back, using our own order-level attribution rather than platform claims), by first product (which entry products create your best customers), and by first-order discount versus full price (the Karmaloop question). Each view carries its own plain-language reading guide, because a cohort table you cannot read is furniture.
The allowable-CAC card. The table's conclusion, computed for you: what your matured cohorts say a customer is worth by M3 and M12, your ceiling at a 3-month payback target, what you currently pay, and the headroom between them.
The known limitation, stated. Customers are identified by email. A guest who buys twice with two different addresses counts as two people, so your true repeat rate is a bit higher than shown; the table reports its own coverage so you know how much weight to put on it.
LTV and Cohort Setup Checklist: 30 Minutes
- Find your real repeat rate. Not GA4's; your order database's. Count customers with a second order within 12 months. This single number decides whether your growth story is repeat value or first-order profit.
- Compute one cohort by hand. Take January's first-time customers, sum their profit through June, divide by their count. One row is enough to feel how the table works.
- Compute your nCPA. A month's full marketing spend divided by that month's new customers. Compare it with the cohort profit from step 2: are you above or below water, and by which month?
- Set your allowable CAC. Decide a payback target (3 months is a sane default for stores without deep cash reserves), read the matching cumulative profit per customer, and treat that as your bidding ceiling.
- Check who your discounts acquire. Split cohorts by discounted versus full-price first order before your next sale season, not after.
In Enalitica the whole checklist is one screen on the profit dashboard: cohorts compute from your orders and costs automatically, in both profit and revenue, across all four dimensions, with the allowable-CAC card on top. If you want to see what your own customers are worth, book a demo or start on the free plan; the first cohort table usually settles a debate you have been having on gut feel for years.
Frequently Asked Questions
What is a good LTV:CAC ratio for an e-commerce store?
On profit-based LTV, 1.0 is the absolute floor: below it a customer never repays their acquisition cost. How far above 1.0 you need depends on your fixed costs and payback tolerance, not on the widely quoted 3x, which was written for SaaS businesses with 75-85% margins and recurring contracts. More important than the ratio's absolute level is its trend across cohorts and the payback month attached to it.
How long before I can trust my cohort numbers?
A cohort is fully readable at the age you want to measure: trust an M3 number after three months, an M12 number after a year. The classic mistake is comparing a two-month-old cohort's total against a mature one's and concluding LTV is collapsing. Any tool (including ours) should label immature cohorts and never present a young ratio as a 12-month one.
Should LTV be based on revenue or profit?
Profit. Revenue-based LTV systematically overranks customers who buy expensive, low-margin, frequently returned products, and it can make an unprofitable acquisition strategy look healthy (a 3:1 revenue ratio at 40% margin is roughly break-even). If your current tool only offers revenue LTV, mentally multiply by your contribution margin before making decisions with it.
What about predicted LTV?
Useful in theory, unaudited in practice. The prediction models shipped by analytics tools in this category publish no accuracy or backtest numbers, and independent practitioners report systematic overestimation. If you use predictions, keep predicted and actual side by side until they converge; if you must choose, a labeled real number beats an unlabeled guess.
Do guest checkouts break cohort analysis?
They blur it. Identity is usually keyed on email, so one person using two addresses counts as two customers, which understates your repeat rate; shared family emails do the opposite on a smaller scale. Treat measured repeat rates as a floor. A tool should disclose what share of orders carried a usable identity so you know the base you are standing on.
My repeat rate is very low. Is LTV analysis pointless for me?
The opposite: it delivers a different, equally valuable verdict. A low repeat rate means nearly all customer value arrives with the first order, so first-order profitability (POAS above 1.0) is your entire game, and any "we will make it back on repeat purchases" reasoning is unsupported by your own data. The cohort table is how you prove that to yourself and, sometimes more importantly, to whoever keeps proposing deeper discounts.
Why do my columns say M0 and M1 instead of calendar months?
Because every row's customers started at a different time, the table aligns them by age instead: M0 is each cohort's own first month, M1 the next, and so on. Rows never shift as the calendar moves; their next cells simply fill in. This is what makes rows comparable, and it means one calendar month lives on a diagonal across the table, a handy way to spot the effect of a specific sale or outage.
Sources
The outside pages this article relies on. Links checked on 28 September 2026.
- 156,000 DTC customers (bsandco.us)
- only 8% of visitors but 41% of online revenue (adobe-newsroom.de)
- losing $9 per newly acquired customer in 2013 to $29 (simplicitydx.com)
- 2014 Harvard Business Review article (hbr.org)
- never found one (frank-buckler.medium.com)
- David Skok for SaaS companies (forentrepreneurs.com)
- Google's documentation (support.google.com)
- about 1% of sessions driving 43% of revenue (ecommercefuel.com)
- cohorts that only buy on promotion (rejoiner.com)
- higher customer value: a full-funnel approach built around a skin quiz and personalised email sequences lifted 60-day LTV by 49% (commonthreadco.com)
- Anderson and Simester (pubsonline.informs.org)
Figures marked "in Enalitica's data" are aggregates from the real orders of the stores we measure, with no names and no individual orders. How we measure.
See your real numbers
Import 30 days of orders or leads during a 5-minute onboarding. Works for e-commerce and service businesses.
See plans and pricing