
POAS: The Metric That Tells You If Your Ads Actually Make Money
ROAS measures revenue, not profit. POAS divides real profit by ad spend, so break-even is always 1.0. What it is, why it matters in 2026, and how to use it.

Tilen Ledic
Written by
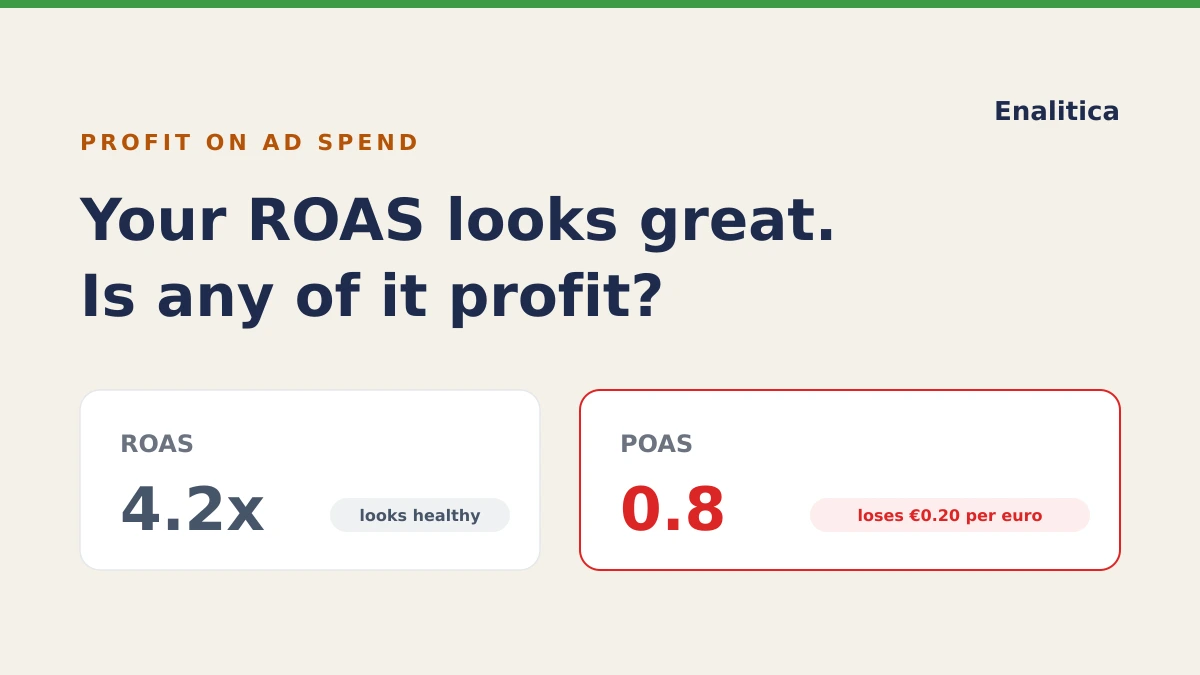
Here is a conversation I have had, in some form, with dozens of store owners. They open their ads dashboard and show me a campaign with a 4.2x ROAS. It has run for months. The agency is proud of it. Then we open their accounting and walk through what those orders actually cost: the products themselves, shipping, payment fees, the VAT that was never theirs to keep, and the steady trickle of returns. By the end of the exercise the same campaign is losing about twenty cents on every euro it spends: a POAS, or profit on ad spend, of 0.8.
Nobody lied. The dashboard was right about revenue. It just never claimed to say anything about profit, and everyone in the room had quietly assumed it did.
This post is about the metric that closes that gap: POAS, or Profit on Ad Spend. What it is, why the economics of 2026 make it hard to ignore, how to calculate it for your own store, and where the traps are (returns, VAT, and multi-channel journeys). Along the way I will show how we built this into Enalitica, because seeing the numbers side by side makes the idea click faster than any formula.
What POAS (Profit on Ad Spend) Actually Measures
POAS divides the profit your ads generate by what the ads cost:
POAS = gross profit from attributed orders ÷ ad spend
Gross profit here means revenue after the variable costs of each order, close to what accountants call contribution margin: product costs (COGS), shipping, payment fees, packaging, and with VAT stripped out. Not revenue. Not revenue minus some average margin guess. The actual profit left from the actual orders a campaign drove.
That one substitution changes how the number reads:
- Break-even is always 1.0. A POAS above 1.0 means the campaign creates profit before fixed costs. Below 1.0, it destroys money with every euro spent. You do not need to remember your margin to interpret it.
- A POAS of 2.2 means €2.20 of profit for every €1 of ads. No mental arithmetic about margins required.
- It is comparable across campaigns. A ROAS of 3.5 on kitchen furniture and a ROAS of 3.5 on accessories are completely different businesses. A POAS of 1.4 is a POAS of 1.4.
Compare that to ROAS, where break-even depends entirely on your margin: at a 25% gross margin you need ROAS 4.0 just to not lose money, while at 60% margin ROAS 1.7 is already profitable. The formula is break-even ROAS = 1 ÷ gross margin. Every store has a different one, most owners have never computed theirs, and it silently shifts every time your product mix or discounting changes. We covered that math in depth in our blended ROAS and MER guide. The break-even moves furthest during big sales: on Black Friday an average discount eats three quarters of the profit while ROAS drops barely a third.
The term POAS was popularized by the Danish company ProfitMetrics, whose founder built it out of his own near-bankrupt store's numbers, and the name is literally their registered trademark (filed in March 2022). The idea is older than the acronym: return on ad spend was always supposed to mean profit. Somewhere along the way "return" got replaced by the most convenient available number, and that number was revenue.
POAS, ROAS, MER: which answers what
| Metric | Formula | Answers | Break-even |
|---|---|---|---|
| ROAS | attributed revenue ÷ ad spend | Is this campaign selling? | 1 ÷ your margin (varies!) |
| POAS | attributed profit ÷ ad spend | Is this campaign earning? | Always 1.0 |
| MER | total revenue ÷ total marketing spend | Is my marketing efficient overall? | 1 ÷ your blended margin |
| Net margin | net profit ÷ revenue | Is my business healthy? | 0% |
None of these replaces the others. MER is your company-level guardrail, ROAS tells you which campaigns sell, POAS tells you which ones earn. The expensive mistakes happen when one is used to answer another's question.
Why ROAS Keeps Misleading Good Operators
ROAS is not a bad metric. It is an incomplete one, and it fails in predictable, expensive ways.
Your products do not have one margin. The ad platform optimizes toward conversion value, and revenue-fed algorithms systematically drift toward expensive, low-margin products, because a €900 order looks better than a €250 order even when the €250 one carries three times the profit. Practitioners who segment campaigns by margin hit another wall: in Google Shopping, a large share of purchases are not the product that was clicked, so campaign-level margin labels dissolve on contact with reality. Only order-level profit survives that.
Discounts hit profit disproportionately. A 20% discount on a product with a 50% margin does not reduce your profit by 20%. It reduces it by 40% (the €50 of profit in a €100 sale drops to €30). During sale periods, revenue-based dashboards glow green exactly when per-order profit is thinnest. If you have ever had a record-revenue month that somehow did not show up in the bank account, this is usually where it went.
Returns arrive after the dashboard has moved on. US retailers estimate 15.8% of all sales were returned in 2025, and 19.3% of online sales, per the National Retail Federation. Fashion runs higher still: apparel return rates of 25% are normal and online-only ranges of 30 to 40% are documented. Ad platforms report conversion value at purchase time and, for the most part, never subtract what comes back. With a 10% return rate, a reported 4.0x ROAS is really about 3.6x. At fashion-level return rates the correction is much uglier.
VAT was never your money. In the EU, prices are displayed with VAT included, and most tracking setups send that VAT-inclusive value as the conversion value. Your ad costs, meanwhile, are billed without VAT. At Slovenian or Croatian VAT rates this inflates every ROAS figure by roughly a fifth against a cost base that got no such boost. This is not hypothetical: when Shopify's Google app silently switched conversion values to include VAT, merchants' ROAS jumped overnight with no change in the business. POAS forces the discipline: profit is computed on VAT-exclusive revenue or it is not profit.
Rising ad costs shrink the room for error. Average Google search CPC hit $5.26 in 2025, up 12.9% year over year, with costs rising in 87% of industries (WordStream benchmarks). Meta's own earnings report the average price per ad rising quarter after quarter. SimplicityDX estimated that brands now lose $29 on average acquiring each new customer, versus $9 a decade earlier. When customer acquisition costs keep climbing while typical e-commerce net margins sit between 5 and 10%, the distance between "great ROAS" and "losing money" is a few percentage points of cost you are not tracking.
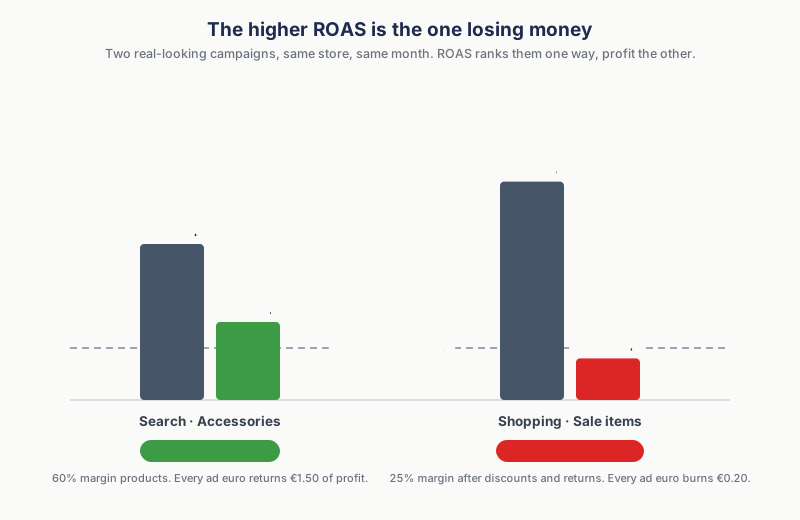
Put those together and you get the picture below: two campaigns from the same store, same month. ROAS ranks B above A. Profit says the opposite.
And this is the anatomy of a single order, the thing ROAS never shows you. Out of €100 of "revenue", the part that is actually yours to keep is a rounding error by the time products, VAT, logistics and the ads themselves are paid:
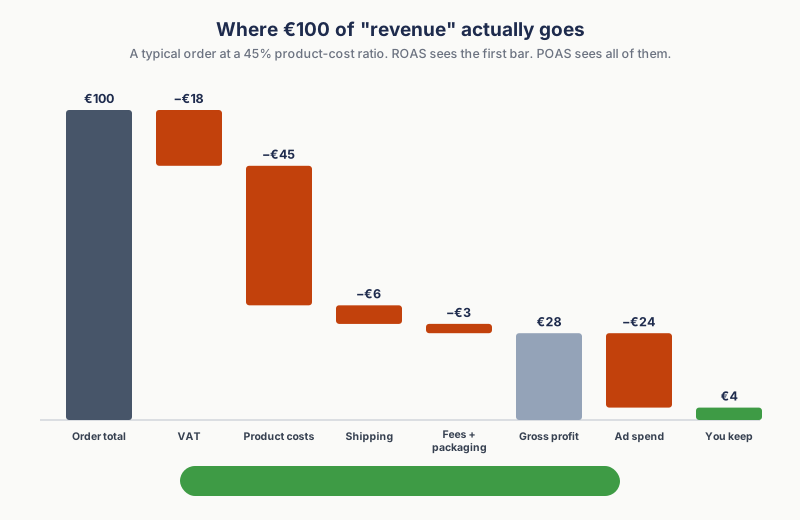
A campaign can double its ROAS and still slide backward on this waterfall if the extra orders come from discounted, low-margin, frequently-returned products. That is the entire argument for POAS in one chart.
Is Your ROAS Inflated by VAT? The Five-Minute Check
Of all the sources of ROAS inflation above, VAT deserves its own five minutes, because it is the easiest to verify and almost nobody has.
The mechanics, once more, in one line: EU prices include VAT, most purchase tags send that VAT-inclusive total as the conversion value, and Google and Meta bill your ad costs without VAT. Inflated numerator, honest denominator, every ratio built from them optimistic.
How to check what your purchase tag actually sends:
- The one-day comparison. Take yesterday's conversion value from Google Ads and compare it with the VAT-exclusive revenue of the same orders in your store admin. If the conversion value tracks your gross totals, your tag sends VAT.
- The test-order check. Place an order with Google Tag Manager's Preview mode open and read the
valueon the purchase event. In WooCommerce, every major tracking plugin defaults differently on tax and shipping; GTM4WP literally has a checkbox called "Track order values including taxes". Never assume, look. - Shopify. The official Google & YouTube app switched to VAT-inclusive conversion values without an announcement. If your ROAS jumped about a fifth with no change in the business, that was it.
The worked example at 22% VAT (Slovenia):
| What the tag sends | Ex-VAT reality | |
|---|---|---|
| One order | 122 EUR | 100 EUR |
| Month of conversions | 12,200 EUR | 10,000 EUR |
| Ad spend (always ex-VAT) | 2,000 EUR | 2,000 EUR |
| ROAS | 6.1 | 5.0 |
The dashboard says 6.1; the business produced 5.0. And every number built on top inherits the gap: set a tROAS target of 4.0 with a VAT-inclusive tag and Google happily delivers gross 4.0, which is net 3.28. If your true break-even sits at 3.5, the campaign that looks safely above target is quietly under water.
One more wrinkle before you fix it with a calculator: dividing everything by 1.22 only works while you sell into one country. The moment Croatian (25%), Austrian (20%) or German (19%) orders mix in, no single factor is correct; the correction has to happen per order, at each order's own rate.
In Enalitica the two truths sit side by side on purpose. The ROAS column mirrors the platform's gross numbers, so it always reconciles with what your agency sees in Ads Manager. Every profit metric next to it (POAS, MT POAS, MER, net profit) is computed VAT-exclusive per order: recorded tax first, so cross-border orders carry their true rate automatically, per-country standard rates when your store records no tax, and your own override on top. And if most orders arrive without tax data while derivation is off, the Dobicek dashboard shows a red warning instead of quietly reporting inflated profit.
How Enalitica Computes POAS (and Why It Starts With Orders)
The hard part of POAS was never the division. It is knowing the real profit of each order, which means knowing costs at the item level and attributing the order to the campaign that earned it. Enalitica already does the second part with order-based attribution (every order tied to a click ID and journey, as described in our ecommerce attribution guide), so POAS was a matter of teaching orders what they cost. Here is how it works:
Product costs flow in from wherever you already keep them. Shopify "Cost per item" and WooCommerce COGS fields sync automatically. Price lists (supplier CSVs) can be uploaded and matched by SKU. Stores on an ERP can pull purchase prices directly, including from delivery documents, which bypasses messy SKU mappings entirely. For products with no recorded cost, a fallback margin fills the gap and the order is transparently marked as estimated, and a fix-it queue shows the highest-revenue products still missing costs, so ten minutes of data entry fixes most of the coverage.
Every order's profit is computed individually. Revenue without VAT (with per-country VAT rates when your store records none), minus item costs, shipping by your real rate structure, payment fees, packaging. Refunds reduce the kept revenue of exactly the affected orders. The result is POAS per campaign, per channel, and blended, sitting right next to ROAS in every table:
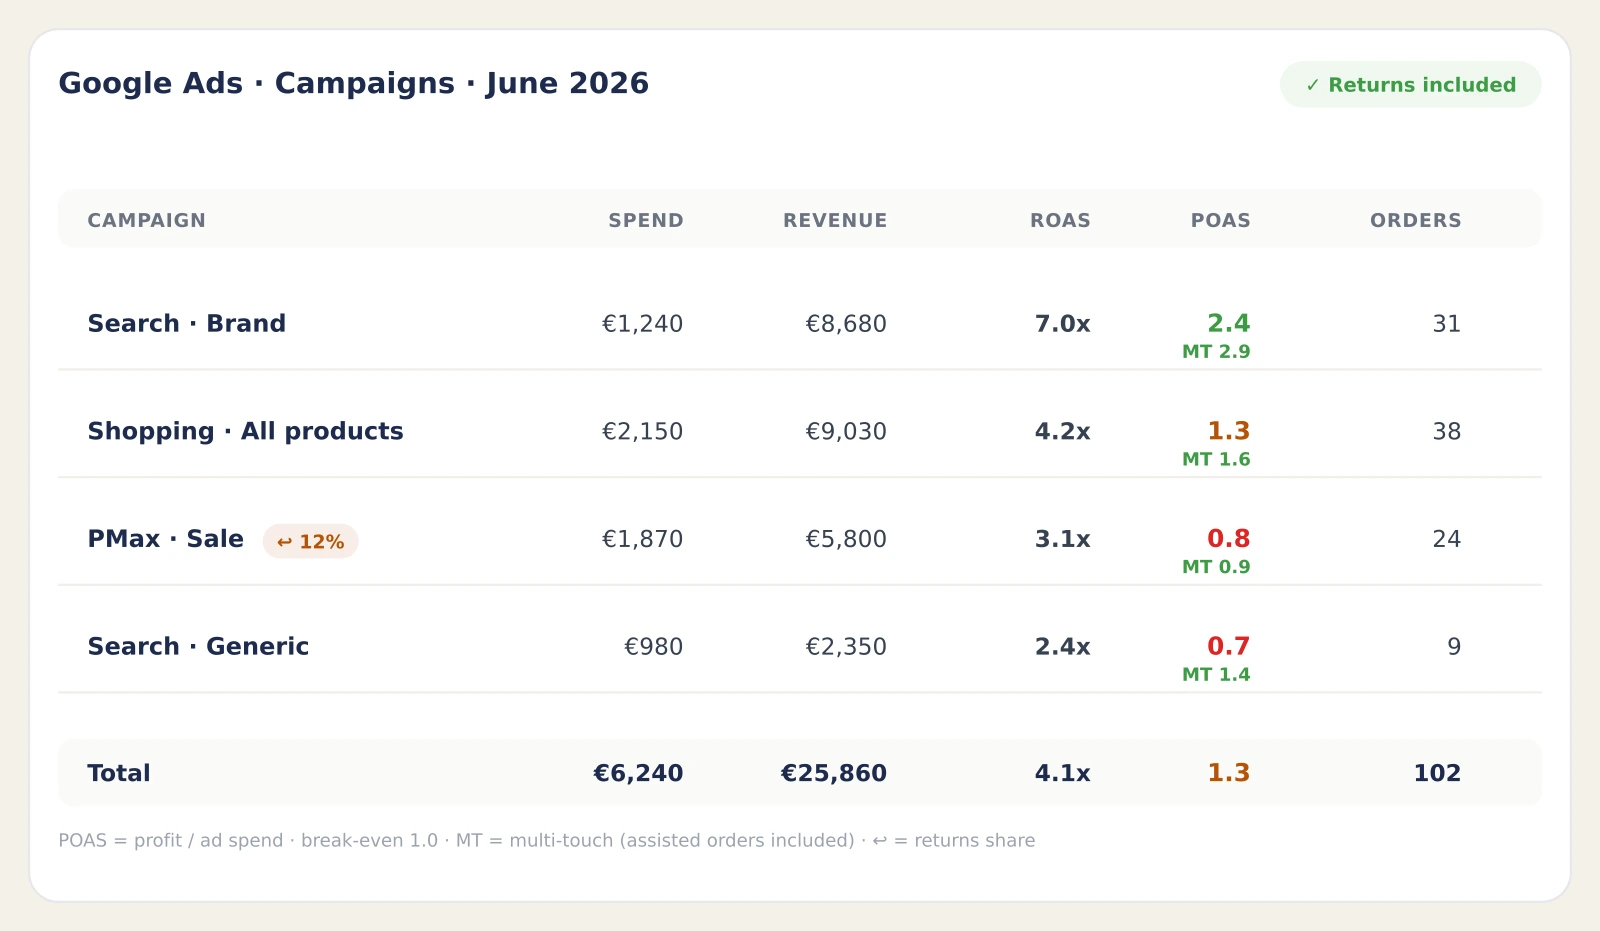
Read the last two rows of that table for the whole story. "PMax · Sale" has a respectable 3.1x ROAS, a red 0.8 POAS, and 12% of its sales coming back as returns: it is buying revenue at a loss (why ROAS and profit part ways most often on Performance Max campaigns is broken down separately). "Search · Generic" looks even worse on direct POAS (0.7), but look at the small green number underneath.
MT POAS: The Number We Could Not Find Anywhere Else
Campaigns do not work alone. A generic search ad introduces the customer, they come back three days later through a brand search or a newsletter, and the last click gets all the credit. Direct, last-touch profit numbers systematically punish the campaigns that start journeys and reward the ones that finish them. We wrote about the revenue side of this in our multi-touch attribution guide; the profit side is exactly the same trap, with sharper teeth, because the campaigns that introduce new customers usually have the worst-looking direct numbers of all.
So Enalitica computes POAS twice for every campaign:
- Direct POAS: profit of the orders this campaign closed, divided by its spend. The floor.
- MT POAS: profit of every order this campaign touched anywhere on the path to purchase, assists included, divided by the same spend. The ceiling.
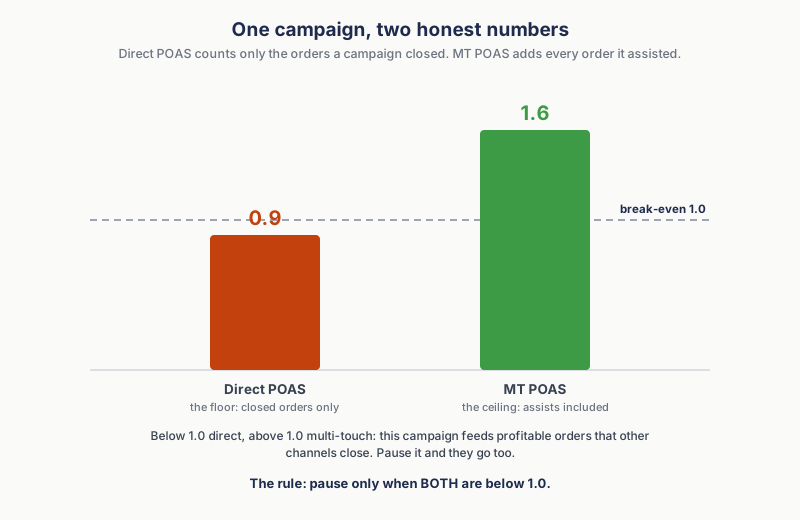
The decision rule that falls out of the pair is simple enough to run a business on: pause a campaign only when both numbers are below 1.0. Direct below, multi-touch above (like the 0.7 / MT 1.4 generic campaign in the table) means the campaign feeds profitable orders that other channels close. Kill it and those orders start disappearing from channels that look self-sufficient today, and nobody will connect the two events.
In researching this post we went looking for other tools that publish this pair. The profit trackers compute margins per order but hang them on last-click, UTM, or the ad platforms' own attribution; the closest we found surfaces "assisted purchases" as a count, without putting a profit value on them. The attribution platforms model multi-touch journeys in real depth, but what they distribute across touchpoints is revenue, not per-order profit. We could not find another tool that documents an assisted-profit figure (a multi-touch POAS) next to the direct one per campaign. If one exists, we would genuinely like to see it; until then, treat MT POAS as the reason a direct number alone should never trigger a pause.
Profit per campaign has a second axis, the product: a campaign's POAS is the average of the products it sells, and our ecommerce product attribution guide shows how the same ROAS hides a profitable and a loss-making product side by side.
How Returns and Refunds Reduce Your Ad Profit
Returns and refunds break profit metrics in a way that is invisible until you fix it. Returns are where profit quietly leaves the building: a returned order is not a smaller sale. It is negative profit: you paid for the click, the payment processing, often the outbound and return shipping, and depending on category and condition you may not even restock the item.
Enalitica treats returns as a first-class part of POAS rather than a footnote:
- Fully returned or cancelled orders drop out of revenue, profit and POAS entirely, and are shown separately so you can see how much they took with them.
- Partial refunds are captured from WooCommerce and Shopify automatically (including refunds issued weeks after import) and reduce the kept revenue of that specific order. Product costs are deliberately not reduced, because refunded goods frequently cannot be restocked; the profit number stays conservative.
- Every campaign shows its returns share. An amber chip next to a campaign name means at least 5% of its sales came back. The Google Ads view goes one level deeper with a returns-by-keyword table, which is how you discover that one search term sells items that come back a quarter of the time.
- The dashboard says so. A "Returns included" badge sits on the profit views, because a profit number that silently ignores returns is just ROAS with better marketing.
Then there is the piece most setups miss completely: the ad platforms never hear about the return. Google's Smart Bidding and Meta's algorithms keep optimizing toward that customer profile, happily finding you more customers who buy and return. Google Ads actually supports fixing this with conversion adjustments: a retraction deletes a conversion entirely, a restatement changes its value, within a window of roughly 55 days. Almost nobody uses it manually. Enalitica automates it: when an order is returned, the conversion we originally sent to Google is retracted; when it is partially refunded, it is restated to the kept amount, every day, without anyone thinking about it. Your bidding algorithm learns from what you kept, not from what you briefly held.
Meta is the honest asterisk here: the Conversions API has no supported refund event, so Meta-reported ROAS stays gross of returns no matter what tooling you use. That is precisely why your own returns-adjusted ledger matters; it is the only place the corrected number can exist. (More on the server-side plumbing in our Meta CAPI guide.)
What About Bidding on Profit Directly?
If profit is the number that matters, the logical endgame is to hand the ad platforms profit instead of revenue as the conversion value, and let their bidding optimize toward it. Google's value-based bidding supports arbitrary conversion values plus value rules; Meta announced profit-margin optimization as a beta in mid-2025. Practitioners who run profit values report the algorithms shifting away from discount-hunters and toward customers who buy full-price, high-margin items. The counterargument (worth knowing) is that profit values are noisier and thinner than revenue values, which can slow the algorithms down on smaller accounts.
Our position: measure first, bid later. Until your POAS per campaign is trustworthy (costs covered, VAT handled, returns flowing in), profit bidding would automate a guess. Enalitica today sends verified, deduplicated conversions to Google and Meta and corrects Google when orders come back; sending profit as the conversion value is on our roadmap, and it will inherit the same order-level cost data POAS already runs on.
POAS Implementation Checklist: 30 Minutes
You do not need a tool to start thinking in POAS. You need one to stop computing ad spend profitability by hand every Monday.
- Compute your break-even ROAS once: 1 ÷ gross margin. If your blended margin is 40%, any campaign under 2.5x ROAS is losing money before fixed costs. This single number reframes most dashboards.
- Get product costs into your store. Shopify's Cost per item field or WooCommerce's COGS field. Start with your 20 best-selling products; they carry most of your spend.
- Decide your per-order costs: average shipping cost, payment fee percentage, packaging. Rough is fine; wrong-by-design (zero) is not.
- Check your VAT basis. If your conversion values include VAT, every ROAS target you have is about 20% too optimistic.
- Watch the pair, not the point. When you can see direct and multi-touch POAS side by side, use the rule: scale what is above 1.0 on both, investigate what is split, pause what is below on both.
In Enalitica this is the Costs and profit setup, and the checklist above maps to about ten minutes of clicking because costs sync from the store. Every metric in the dashboard explains its own formula in plain language, so you never have to trust a number you cannot decompose. If you want to see your own campaigns through the POAS lens, book a demo or start on the free plan; costs import in minutes, and the first table usually contains at least one 4x-ROAS campaign that has been quietly eating margin for months.
Frequently Asked Questions
Is POAS better than ROAS?
It answers a better question. ROAS tells you which campaigns generate revenue; POAS tells you which generate profit. If you only ever look at one number per campaign, POAS is the safer one, because its break-even (1.0) cannot be misread. In practice you want both: ROAS for volume and momentum, POAS for whether the volume is worth having.
What is a good POAS?
Above 1.0 a campaign creates gross profit; below 1.0 it destroys money. But 1.0 only covers the order's own variable costs. It contributes nothing to rent, salaries, or software. Many operators set a working floor around 1.3 so that ad-driven orders also carry their share of fixed costs. The right threshold is your fixed costs divided by your gross profit, which is a five-minute spreadsheet exercise worth doing once a year.
Do I need perfect cost data for every product?
No, and waiting for perfect data is the classic reason profit tracking never ships. Cover your best sellers with real purchase prices, apply a fallback margin to the rest, and let the tool mark which orders are exact and which are estimated. In Enalitica, orders with any estimated component are flagged, and a queue shows the highest-revenue products still missing costs, so coverage improves where it matters most first.
How does POAS handle returns and refunds?
If it does not, it is not measuring profit. A returned order should leave your revenue and profit entirely; a partial refund should reduce that order's kept revenue. Enalitica does both automatically from WooCommerce and Shopify data, shows each campaign's returns share, and retracts or restates the conversions previously sent to Google Ads so bidding learns the corrected values. Meta offers no refund mechanism, which makes an independent returns-adjusted ledger the only trustworthy source.
Does POAS include VAT?
It must not. VAT is collected on behalf of the state and never belongs to the store, so profit is computed on VAT-exclusive revenue. This matters doubly in the EU, where displayed prices include VAT and ad costs do not. Enalitica strips recorded VAT per order and can derive it by country when a store's orders arrive without tax data.
What is the difference between POAS and MER?
MER (total revenue divided by total marketing spend) is a company-level efficiency guardrail; POAS is a per-campaign profit verdict. MER catches problems POAS cannot see (like paid channels cannibalizing organic), and POAS localizes problems MER can only detect in aggregate. Our blended ROAS and MER guide covers how the two work together.
Sources
The outside pages this article relies on. Links checked on 19 July 2026.
- filed in March 2022 (trademarks.justia.com)
- a large share of purchases are not the product that was clicked (savvyrevenue.com)
- 15.8% of all sales were returned in 2025, and 19.3% of online sales (nrf.com)
- silently switched conversion values to include VAT (feedarmy.com)
- $5.26 in 2025, up 12.9% year over year, with costs rising in 87% of industries (wordstream.com)
- lose $29 on average acquiring each new customer (simplicitydx.com)
- every major tracking plugin defaults differently (seresa.io)
- conversion adjustments (support.google.com)
- value rules (support.google.com)
See your real numbers
Import 30 days of orders or leads during a 5-minute onboarding. Works for e-commerce and service businesses.
See plans and pricing