
Blended ROAS and MER, Explained
What blended ROAS and MER are, how to calculate them, why they survive the attribution crisis, and how to set a target from your margin. With a free calculator.

Tilen Ledic
Written by
Why Do Blended ROAS and MER Exist?
Open your ad dashboards at the end of the month and add up what they claim. Meta takes credit for one pile of revenue, Google for another, TikTok for another, and the total comes close to, or past, everything your store actually made, including sales no ad ever touched. Each platform reports as if it were the only channel that mattered, and none of them can see the others.
The order only happened once. So why does every ad platform want full credit for the same order?
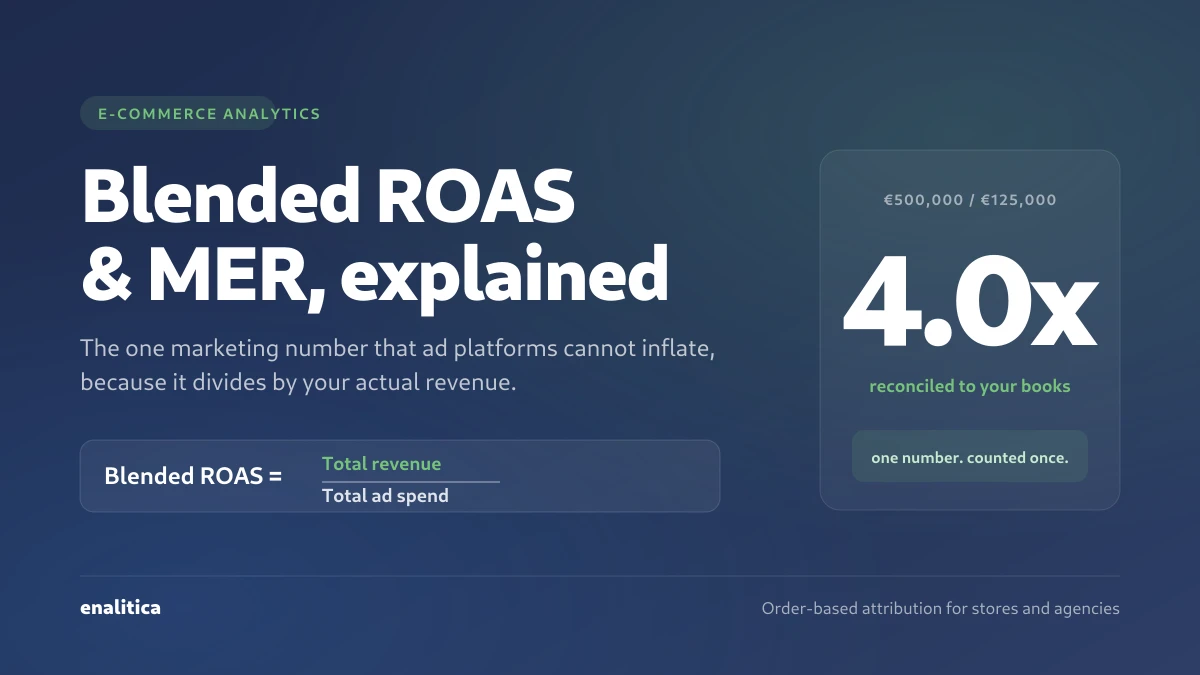
This is the reason blended ROAS and MER (marketing efficiency ratio) exist. Instead of trusting each platform's self-graded homework, you divide one honest number by another: total revenue by total marketing spend. The result is attribution-free measurement: no attribution model to argue about, no double-counting, no cookie that expired. Divide €500,000 of revenue by €125,000 of ad spend and your blended ROAS is 4.0x. That number holds whether or not iOS blocked the pixel, whether or not the customer cleared their cookies, whether or not Meta and Google both claimed the same sale.
This guide covers what blended ROAS and MER actually are, how to calculate them, what a "good" number looks like for your margin, where they help and where they mislead, and how we compute an accurate blended ROAS inside Enalitica by dividing your real order revenue by your real ad spend. For how all of this fits with per-channel attribution, see our complete guide to ecommerce attribution.
What Is Blended ROAS (and Is It the Same as MER)?
Blended ROAS measures how much total revenue your business earns for every euro of total marketing spend, across every channel at once, instead of per campaign or per platform.
The formula is deliberately boring:
Blended ROAS = Total revenue ÷ Total ad spend
If you did €500,000 in revenue on €125,000 in ad spend, your blended ROAS is 4.0x. That is it. No windows, no view-through, no machine learning.
MER (Marketing Efficiency Ratio) is the same idea with a wider denominator, and the width is the whole point. Shopify defines MER as total revenue divided by total marketing spend, a blended view across every channel including organic traffic and influencer work, where ROAS evaluates specific campaigns or channels. Many operators use the two terms as one. This guide does not, because the difference is where profit hides:
- Blended ROAS divides revenue by paid ad spend only (Google + Meta + TikTok + the rest).
- MER divides the same revenue by all marketing cost: ad spend plus agency retainers, tools, influencer fees, creative production, marketing salaries.
With the €125,000 of ad spend above and, say, €25,000 of agency and tooling in the same month, a 4.0x blended ROAS is a 3.33x MER. The ads did not get worse; the euros that have to come out of the same gross profit got counted. Judge profitability on MER, because the agency invoice does not disappear just because the ad platform cannot see it. Then hold the scope constant, so the trend stays comparable month to month. A "4.0x MER" that quietly drops the agency fee one month and adds it back the next is telling you nothing.
One more note so a number never confuses you: some finance-minded teams write MER inverted, as spend divided by revenue, and express it as a percentage. A "25% MER" and a "4.0x MER" describe the exact same business (1 ÷ 0.25 = 4). This guide uses the ROAS-style multiple throughout: revenue over spend.
Blended ROAS vs platform ROAS vs channel ROAS
Three numbers get called "ROAS" and they answer three different questions.
| Metric | What it divides | What it answers |
|---|---|---|
| Platform ROAS | Revenue the platform claims it drove, by spend on that platform | "What does Meta or Google say it made me?" (self-graded) |
| Channel ROAS | Revenue your attribution model credits to a channel, by that channel's spend | "What does my model credit this channel?" |
| Blended ROAS | Actual total revenue from your books, by total ad spend | "For every euro I put into ads, how many came back?" |
| MER | Actual total revenue from your books, by all marketing cost (ads, agency, tools, creative) | "For every euro I put into marketing, how many came back?" |
The structural difference is the numerator. Platform and channel ROAS both divide a slice of attributed revenue by a slice of spend, and that slice is exactly where tracking loss and double-counting do their damage. Blended ROAS divides your real booked revenue, a hard number from your store or accounting, by your real spend. No platform can inflate a number it does not get to report.
Try It: Blended ROAS, MER and Break-Even Calculator
Plug in your own numbers: revenue, ad spend, other marketing costs (agency, tools, creative, salaries; 0 if none) and gross margin. The calculator returns blended ROAS and MER as two separate figures, your break-even MER (the point below which marketing as a whole loses money), a suggested target with room for profit, the profit left after marketing in euros, and a plain verdict judged on MER. When ads alone clear break-even but the whole budget does not, it says so in a sentence. The math behind each output is explained in the sections just below. The same tool also lives at a permanent address as a standalone blended ROAS and MER calculator.
Blended ROAS and MER calculator
Enter what you sold, what you paid for ads, what you paid for everything else around marketing, and your margin. The calculator tells you how much is left after marketing, not just after the ads. (For those who know the terms: ads alone is blended ROAS, all marketing cost together is MER.)
All three numbers start from what you actually sold, so tracking loss (iOS, cookies) never shrinks them. Ads alone says whether the ads pay; all costs together says whether marketing pays. Neither says which channel brought the sale.
The default figures are the €500,000 / €125,000 example from the top of this post, with €25,000 of other marketing costs, at a 45% gross margin. Change the margin and watch the break-even move: that single input decides whether a "3x" is a win or a loss. Then set the other costs to zero and watch MER climb back up to blended ROAS: that gap is what a platform dashboard never shows you.
How Blended ROAS Is Measured
The formula is one line. The judgment is in what you feed it.
What counts as revenue. Default to the total revenue booked in the period, straight from your store or ERP. For a margin-honest number, use net revenue after returns, refunds, and discounts, because gross flatters the ratio. The important discipline: total-business revenue includes returning-customer and organic sales that paid ads did not necessarily cause. That is a feature for measuring overall efficiency and a trap for judging acquisition (more on that in the "good ROAS" section).
What counts as spend. Decide once and document it:
- Narrow (most common): total paid ad spend across every platform. This is what most people mean by "blended ROAS."
- Broad (a truer efficiency ratio): ad spend plus agency fees, martech subscriptions, influencer costs, creative production. This is closer to a real MER.
Whether agency fees and tools belong in the denominator is not standardized, so the only wrong move is changing your mind mid-year.
An illustrative worked example, narrow scope:
- Total revenue: €500,000
- Total ad spend: €125,000
- Blended ROAS = 500,000 ÷ 125,000 = 4.0x
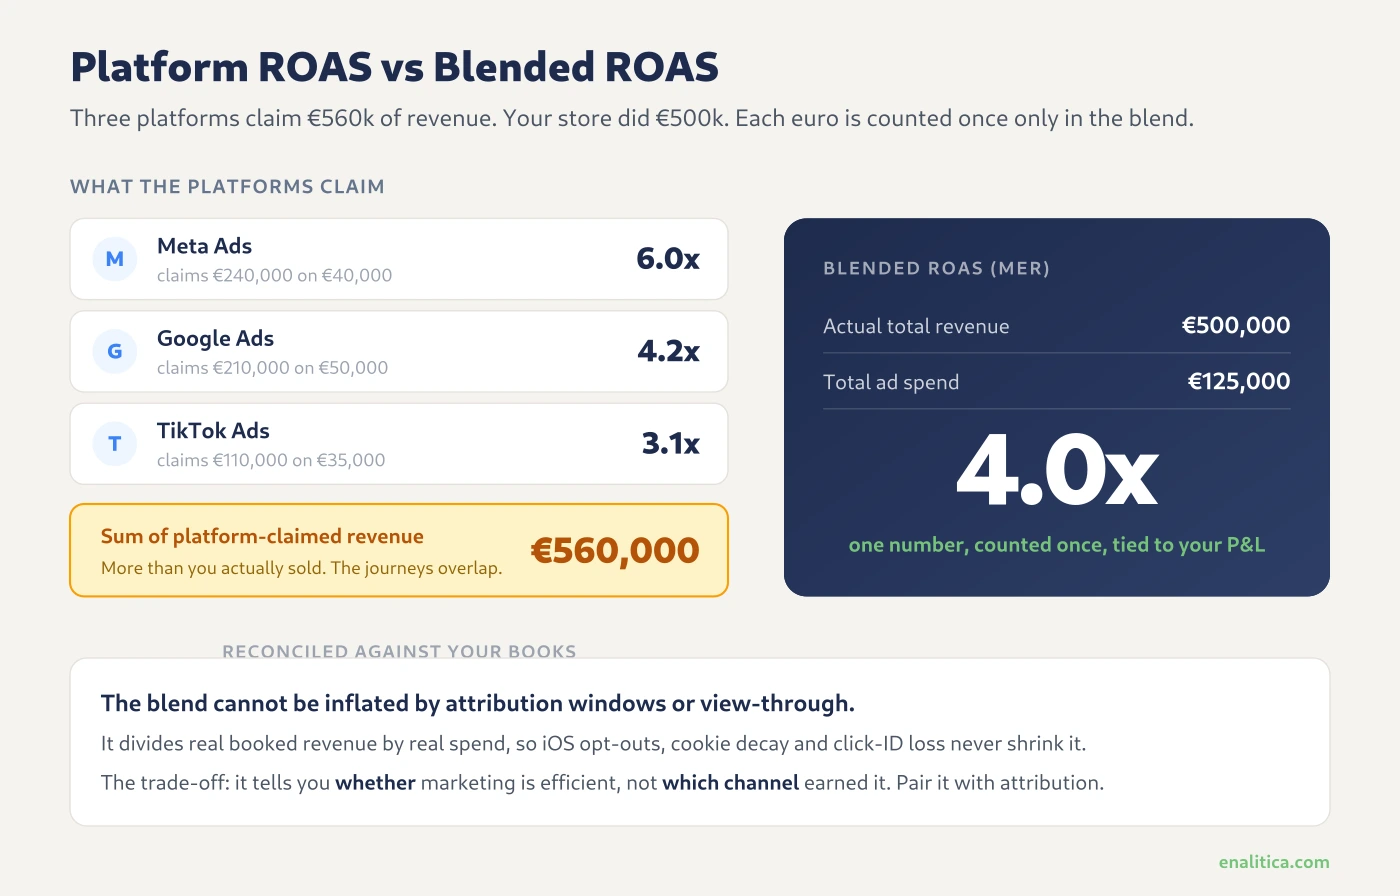
Now the same month seen through the platforms (illustrative numbers):
| Channel | Platform claims | Spend | Platform ROAS |
|---|---|---|---|
| Meta Ads | €240,000 | €40,000 | 6.0x |
| Google Ads | €210,000 | €50,000 | 4.2x |
| TikTok Ads | €110,000 | €35,000 | 3.1x |
| Sum of claims | €560,000 | €125,000 | 4.5x |
| Reality (your books) | €500,000 | €125,000 | 4.0x |
The platforms collectively claim €560,000, more than the entire store sold that month. That is only possible because they each count overlapping journeys inside their own attribution windows, and Meta layers view-through on top. The blend counts each euro of revenue once. This is the same double-counting mechanism we break down in how Meta, Google, and Enalitica count conversions.
The Attribution Crisis That Made Blended Measurement Necessary
Blended ROAS is not new. It became essential because the thing it replaces, user-level attribution, quietly broke.
iOS App Tracking Transparency. Since iOS 14.5 (April 2021), apps need the user's permission through Apple's App Tracking Transparency framework before they can track that person across other companies' apps and websites, and many iPhone users decline. Overnight, a large slice of conversions became unmeasurable at the user level.
Browser and cookie loss, independent of Apple. Safari blocks cross-site cookies by default and deletes script-written storage after seven days without a visit, and Firefox restricts cross-site tracking too. Click-based attribution that depends on a cookie surviving the trip from ad to checkout simply does not fire for those users. The loss shows up in Enalitica's data: with more than 10,000 orders in stores where both are connected, last 90 days to 28 September 2026, GA4 fired purchase events for only 76.6% of the orders the stores actually had.
Platform over-reporting. Each platform runs its own attribution model in isolation and none of them can see the others. Meta's standard setting on most purchase ad sets counts 7-day click, 1-day engage-through and 1-day view (check yours in the ad set), which means it will claim a sale where the customer merely saw an ad within a day and never clicked. When several platforms each apply their own overlapping window to the same buyer, the sum of claimed conversions runs far past the orders ads actually touched.
The stores in Enalitica's data with both Meta and Google Ads connected took in over €700,000 across more than 10,000 orders in the last 90 days to 28 September 2026, 10,458 orders to be exact; against those, the two platforms reported 10,453 conversions between them, worth about three quarters of all store revenue.
Meta and Google Ads claimed as many conversions as the stores had orders in total, including email, organic and direct sales. Across more than 6,500 order journeys, only 33.3% of orders had a paid ad click anywhere.
One thing we keep seeing across our clients deserves saying here, because last-click numbers put Meta in a harsher light than it earns: when a store invests seriously in Meta, its organic and direct traffic rise with it, brand searches multiply, and orders arrive days later through channels Meta never gets credit for. We can see the lift; we cannot measure how much of it is Meta's, and neither can anyone honestly. Read the Meta row as a floor, not a verdict; the Meta halo guide explains what we see and why nobody can size it.
The result is a trust gap. When you cannot trust the attributed numerator, you stop dividing by it. You divide by the one number nobody can touch: total revenue. That is the whole case for the blend.
What Is a "Good" Blended ROAS?
The honest answer is that there is no universally good blended ROAS, because your break-even depends entirely on your margin.
Break-even ROAS = 1 ÷ gross margin.
At a 45% gross margin, break-even ROAS is 1 ÷ 0.45 = 2.22x. Below 2.22x, an ad-driven sale loses money. Above it, every extra point is profit. At a 25% margin, break-even is 4.0x, so a "healthy 3x" is actually a loss. At a 70% margin, break-even is 1.43x and a 3x is very comfortable. The same ROAS is a win for one store and a slow bleed for another. This is why "what is a good ROAS" has no answer without the margin next to it.
From break-even you get a target. Multiply by a buffer, commonly 1.3 to 1.5, to leave room for overhead and profit:
Target ROAS = Break-even ROAS × ~1.4
At 45% margin that is 2.22 × 1.4 ≈ 3.1x. That is a target grounded in your P&L, not borrowed from a blog.
As a reference band, Shopify suggests a healthy MER for established companies sits around 3 to 5x. The old "4:1" rule of thumb (four euros back per euro spent) no longer matches reality for most stores as customer acquisition costs (CAC) have climbed. Treat 3 to 5x as a sanity check, not a target. Your target comes from your margin.
The number that hides inside a healthy blend: new-customer MER
Here is the trap. Blended ROAS includes returning-customer and organic revenue. A store with strong repeat purchase and good SEO can post a comfortable 4x blend while its paid acquisition is quietly unprofitable, because loyal customers are carrying the number. The share is not small: in Enalitica's data (nearly 30,000 customers, 12 months to 28 September 2026), 23.4% of all orders were repeat orders, roughly one order in four.
The fix is new-customer MER (you will also see it written as NC-ROAS, aMER or nc-MER; they all mean the same thing):
New-customer MER = New-customer revenue ÷ Total marketing spend
It strips out revenue from existing customers so paid acquisition cannot hide behind repeat orders. If your blended MER is 4x but your new-customer MER is 1.2x on a 45% margin, you are not acquiring profitably. You are harvesting. Growth-focused stores watch both.
You no longer have to compute this by hand: Enalitica derives new-customer MER and cost per new customer from your real orders, and its LTV cohorts group customers by acquisition month so you can see what a new customer buys again later and when each cohort pays back its acquisition cost. We wrote a full owner's guide to that table in customer lifetime value, without the myths.
Blended ROAS vs ROI vs Break-Even ROAS
These four get mixed up constantly. Quick reference:
| Metric | Formula (plain) | Use it when |
|---|---|---|
| Platform ROAS | Platform-claimed revenue ÷ platform spend | In-platform bidding only, never for cross-channel truth |
| Blended ROAS | Total revenue ÷ total ad spend | Whether the ads as a group pay, and the month-to-month trend |
| MER | Total revenue ÷ all marketing cost | Board-level, P&L-tied efficiency; the number to judge profitability on |
| Break-even ROAS / MER | 1 ÷ gross margin | Setting the floor below which ads (or marketing as a whole) lose money |
| ROI | (Gross profit from ads − ad spend) ÷ ad spend | When you want a profit return, not a revenue return |
The ROAS-versus-ROI distinction is the one that costs people money. ROAS is a revenue ratio. ROI is a profit ratio. A 4.0x ROAS at a 45% margin returns €4 of revenue per €1 spent, but only €1.80 of gross profit (4 × 0.45 = 1.80), which is €0.80 of profit after you subtract the €1 you spent. Roughly:
ROI ≈ (ROAS × gross margin) − 1
At 4.0x and 45% margin, ROI ≈ 0.80, or 80%. The calculator above runs the same arithmetic on MER, as the "gross profit per €1 of marketing" line, so agency and tooling euros are in the denominator too: at a 3.33x MER the same store returns €0.50 per euro of marketing, not €0.80. A great-looking ROAS on a thin margin can still be a losing ROI, which is exactly why break-even ROAS belongs on the same screen.
Where Blended ROAS Is Trustworthy
The reasons to keep this number on your dashboard:
- One denominator, one numerator, no argument. Total spend and total revenue are unambiguous. There is no attribution model to debate.
- Immune to tracking loss. Because the numerator is your actual booked revenue, iOS opt-outs, cookie decay, and stripped click IDs do not shrink it. They break per-channel attribution, which the blend does not rely on. This is the headline advantage over everything in the attribution-crisis section.
- No double-counting. Each sale is counted once, so overlapping platform windows and view-through cannot inflate it.
- It ties to the P&L. Blended ROAS moves with real revenue and real spend, so paired with margin it maps straight to profitability. A CFO can read it.
- It is hard to game. You can juice a single campaign's reported ROAS with branded search or retargeting. You cannot fake total revenue divided by total spend.
Where Blended ROAS Misleads
Naming the trade-offs is the whole point of trusting a metric. Blended ROAS has real limits:
- It is blind to channel mix. The blend tells you whether marketing is efficient, never which channel drove it. On its own it cannot allocate a budget.
- It flatters paid performance. Organic, direct, email, and returning-customer revenue all sit in the numerator, so strong brand demand can make paid look better than it is. A rising blend can mask weakening acquisition (see new-customer MER above).
- It shows correlation, not causation. MER moving with spend does not prove the spend caused the revenue. For true lift you need incrementality testing, geo experiments, or marketing mix modeling.
- It is sensitive to seasonality and non-paid demand. A PR spike, a product launch, or a seasonal wave moves total revenue independently of spend, so a single month's blend can mislead. It is a trend metric.
- Spend and revenue can land in different periods. Money spent this month can produce sales next month, which distorts a short-window blend.
The pattern: blended ROAS is the guardrail, not the map. It catches when the sum of "great" platform ROAS fails to show up in the bank. It does not tell you where to move the next €10,000. For that you still need per-channel, order-level attribution.
Best Practices for Tracking Your Marketing Efficiency Ratio
- Track the trend, not the snapshot. A single month's blend is noise. Treat MER as a north-star metric and read direction over weeks and months as the signal.
- Set the target from margin. Break-even (1 ÷ margin) times a 1.3 to 1.5 buffer. Do not borrow "4x" from anyone.
- Watch new-customer MER separately so acquisition health is not masked by repeat and organic revenue.
- Pair the blend with channel attribution. Blended ROAS on top as the P&L guardrail, order-level attribution underneath for allocation. When the two disagree, you have found something worth investigating.
- Reconcile platform claims against reality every month. Sum the revenue every platform claims and divide by your actual revenue, then compare that ratio with the share of orders that had an ad click at all. When the claims cover most of your revenue but only a third of orders came through an ad, the difference is your double-counting, quantified.
- Validate causality with incrementality. Geo holdouts and marketing mix models (Google's open-source Meridian is one) estimate true lift without user-level data, which is why MMM is back in favour now that user-level tracking is patchy.
How Enalitica Computes an Accurate Blended ROAS
You can calculate blended ROAS in a spreadsheet. Anyone can. The two places it goes wrong in practice are the two places we fixed.
The denominator problem. Most "blended" numbers still divide by platform-claimed revenue, or by a rough total someone typed in. That reintroduces the exact inflation the blend was supposed to remove. Enalitica starts from your actual orders. Every order that syncs from WooCommerce or Shopify is real, booked, and reconcilable against your bank statement. That is the numerator. The spend side pulls the actual daily cost from the Google Ads and Meta APIs into one place. So the Blended ROAS figure on your Summary page is real revenue over real spend, not one estimate divided by another. The MER tab goes one step wider: you enter the monthly marketing costs the platforms never see (agency, tools, influencers) once, and MER, break-even MER and net profit are computed with them in the denominator, next to the ad-spend-only blend.
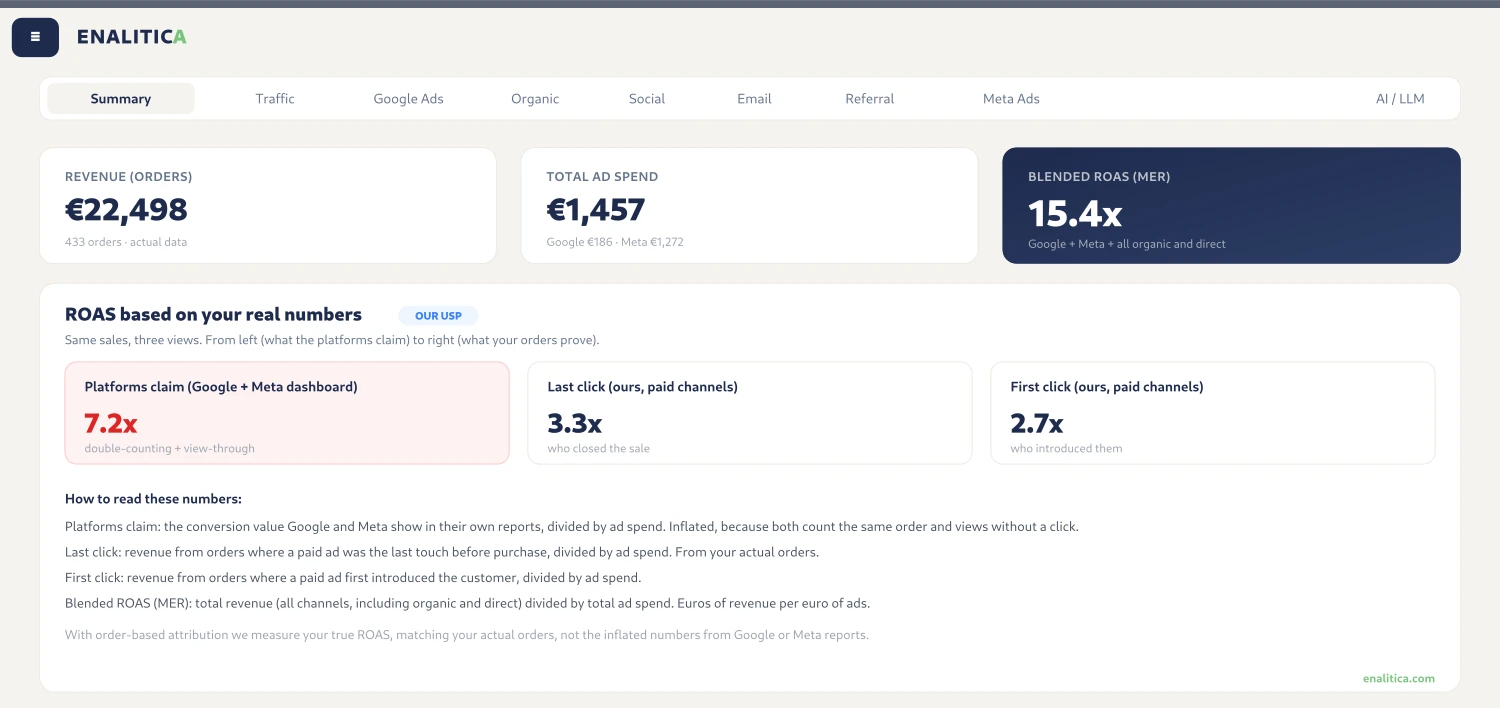
The channel-blindness problem. Blended ROAS on its own cannot tell you which channel earned the sale. That is its biggest limitation, and it is why we never show it alone. Directly beside the blend, Enalitica shows what each platform claims next to what your orders actually prove, using order-based attribution. Because we capture the click ID as a property of the order at checkout, we do not have to model our way back from a session to a sale. The order already knows which click brought it. That gives you both numbers on one screen:
| What it tells you | Where the number comes from | |
|---|---|---|
| Blended ROAS | Are the ads as a group efficient? | Total order revenue ÷ total Google + Meta spend |
| MER | Is marketing as a whole efficient? | Total order revenue ÷ ad spend plus the monthly marketing costs you enter (agency, tools, influencers) |
| Platforms claim | What each platform reports for itself | Google Ads and Meta reporting APIs |
| Order-based (last and first click) | Which channel actually closed and introduced each sale | Click ID captured on the order at checkout |
| POAS, direct and multi-touch | Which campaigns create profit after product costs, shipping and fees | Order profit ÷ campaign spend, costs imported from your store or ERP |
So the blend is your guardrail, and the order-based view is your allocation map, side by side, both drawn from the same real orders. When Meta claims a 6.0x and your blended ROAS is 4.0x while orders attribute far less to Meta directly, you are looking at the gap between what a platform reports and what actually happened, quantified in euros.
The profit layer underneath. The same screen now goes one level deeper than revenue. Enalitica imports your product costs (from Shopify, WooCommerce, your price lists or your ERP), adds shipping, payment fees and packaging, and computes POAS (profit on ad spend) per campaign and channel, always as a pair: direct POAS for orders the campaign closed and MT POAS for every order it assisted, with 1.0 as break-even for both. It also computes the true MER this post describes, with agency retainers, tools and influencer fees included in the denominator, your personal break-even MER derived from your own margins instead of a borrowed benchmark, and a net profit line that subtracts fixed costs. The blend answers whether marketing is efficient; the profit layer answers whether it is actually making you money. We wrote a full owner's guide to that layer in POAS: profit on ad spend, explained.
It survives what breaks the pixel. Because the whole thing is built on orders and server-side data, not browser cookies:
| Factor | Platform / GA4 blended | Enalitica order-based blend |
|---|---|---|
| Ad blocker active | Purchase event may never fire | Order captured from your store database |
| Cookie consent declined | No session, no revenue recorded | Order revenue still counted, click ID still on the order |
| Safari ITP purge | Cookie attribution breaks after 7 days | Click ID persisted on the order indefinitely |
| Revenue accuracy | Estimated, often undercounts | Actual order totals from your store |
| Double-counting | Cannot detect or resolve | One order, counted once, always |
Onboarding takes a few minutes and imports your recent orders enriched with click-ID and ad data immediately. Want an accurate blended ROAS that reconciles to your bank statement, with the channel breakdown next to it? Book a demo and we will run it on your real numbers.
How to Start Using Blended ROAS This Week
- Compute this month's blend. Total revenue ÷ total ad spend. Write it down. That is your baseline.
- Compute your break-even. 1 ÷ gross margin. Everything below this line loses money. Set your target at break-even × 1.4.
- Run the reconciliation. Add up the revenue every platform claims and divide by your actual revenue. Set that against the share of orders with an ad click; the overshoot is your double-counting.
- Split out new-customer MER. New-customer revenue ÷ total spend. If it is near or below break-even, your acquisition needs work even if the blend looks fine.
- Capture click IDs on every order so you can pair the blend with order-level attribution. Start with our guide to capturing GCLID and FBCLID in WooCommerce.
- Track it as a trend. One number per month, plotted. Watch the direction, not the dot.
Frequently Asked Questions
Is blended ROAS the same as MER?
No, and treating them as one is how a profitable-looking month loses money. Blended ROAS divides total revenue by ad spend only. MER divides the same revenue by every marketing euro: ad spend plus agency retainers, tools, creative production, influencer fees and marketing salaries. With no other costs they are the same number; with €25,000 of agency and tooling on €125,000 of ad spend, a 4.0x blended ROAS is a 3.33x MER. Judge profitability on MER, because those costs come out of the same gross profit as the ads do. The calculator shows both and tells you when the ads clear break-even but the whole budget does not.
How is blended ROAS different from the ROAS I see in Google Ads?
Google Ads ROAS divides the revenue Google attributes to itself, using its own model and window, by your Google spend. It only sees Google's slice, and it counts sales that other channels also touched. Blended ROAS divides your entire store's revenue by your entire ad spend across every platform, and MER widens that to every marketing euro. Google's number answers "how are my Google campaigns bidding," the blend answers "is my marketing profitable overall." You need both, but only one of them ties to your bank statement.
What is a break-even ROAS and how do I calculate it?
Break-even ROAS is the point where an ad-driven sale exactly covers its own cost, with zero profit and zero loss. The formula is 1 ÷ gross margin, where gross margin is (revenue − variable costs like COGS, shipping, and transaction fees) ÷ revenue. At a 50% margin, break-even is 2.0x. At 30%, it is 3.33x. Below your break-even, spending more on ads costs you money on every order. The calculator near the top of this post does this for you. Inside Enalitica the same math runs automatically: your break-even MER comes from your real cost data, and every campaign additionally shows POAS, where break-even is always simply 1.0.
Is a 2x ROAS good?
It depends entirely on margin. At a 50% gross margin, break-even is 2.0x, so a 2x is exactly break-even, no profit. At a 70% margin, break-even is about 1.43x, so a 2x is genuinely profitable. At a 30% margin, break-even is 3.33x, so a 2x loses money on every sale. There is no such thing as a good ROAS in the abstract. Compute 1 ÷ your margin first, then judge.
Should I optimize toward blended ROAS or platform ROAS?
Use them for different jobs. Optimize individual campaigns toward platform or channel ROAS, since that is the signal the bidding algorithms actually respond to. Judge the health of your whole marketing operation, and set your total budget, against blended ROAS. The mistake is using platform ROAS to make total-budget decisions, because the platforms' numbers overlap and sum to more than your real revenue.
Why does my blended ROAS look worse than my platform ROAS numbers?
Because platform-reported ROAS is inflated and your blend is not. Each platform claims sales that other channels also touched, so their reported ROAS is optimistic. The blend divides real total revenue by real total spend, with no overlap and no view-through padding. If Meta says 6.0x, Google says 4.2x, and your blend is 4.0x, the blend is the honest figure. It is not that your ads got worse. It is that you stopped double-counting.
Can blended ROAS replace attribution entirely?
No, and using it that way is the classic mistake. Blended ROAS tells you whether marketing is efficient, never which channel to fund. If you cut the channel the blend cannot see credit for, your total revenue can quietly fall. Keep the blend as your P&L guardrail and pair it with order-level attribution for allocation. For validating that a channel truly causes lift, add incrementality testing on top of both.
Sources
The outside pages this article relies on. Links checked on 1 October 2026.
- Shopify defines MER (shopify.com)
- Apple's App Tracking Transparency framework (developer.apple.com)
- Safari blocks cross-site cookies by default (webkit.org)
- 1-day engage-through (facebook.com)
- Meridian (developers.google.com)
Figures marked "in Enalitica's data" are aggregates from the real orders of the stores we measure, with no names and no individual orders. How we measure.
See your real numbers
Import 30 days of orders or leads during a 5-minute onboarding. Works for e-commerce and service businesses.
See plans and pricing