
How Meta, Google, and Enalitica Count Conversions
Meta, Google, and Enalitica count conversions differently. Same orders, three ROAS numbers. Here is why and which to trust for spend decisions.

Tilen Ledic
Written by
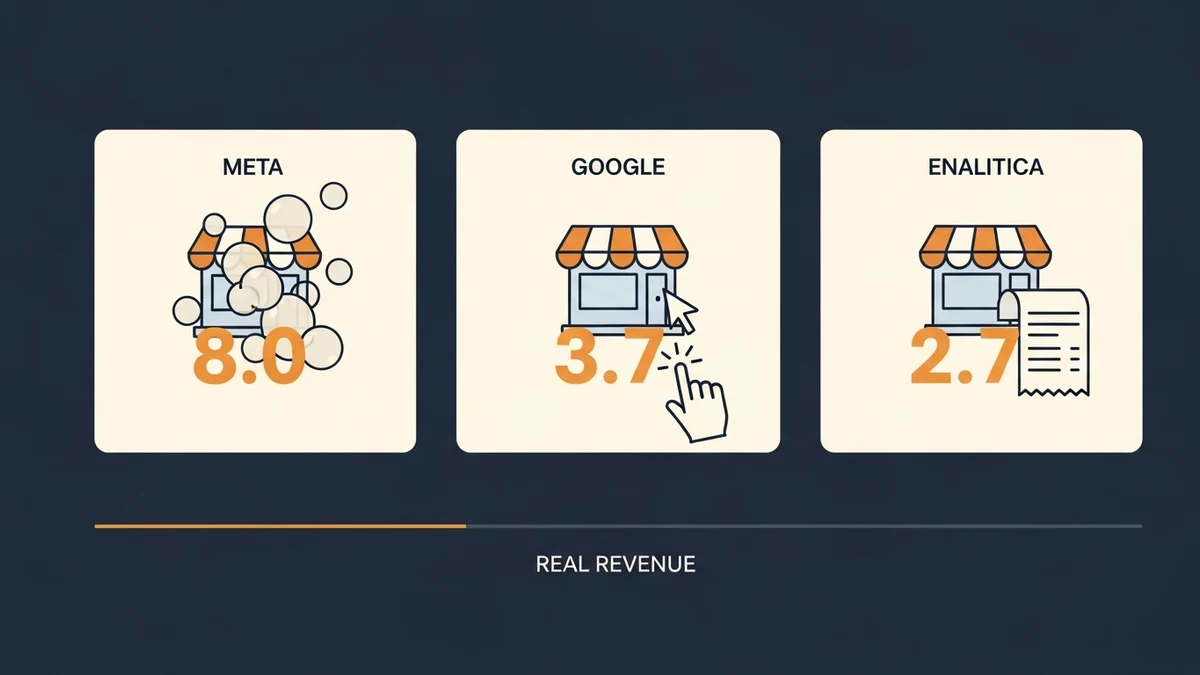
You spent €4,800 on Meta last week. Meta Ads Manager says it returned €38,400 in revenue. ROAS 8.0. Same week, you spent €3,000 on Google Ads. Google says it returned €11,200. ROAS 3.7. Your WooCommerce dashboard, the actual cash register, shows €31,500 in total sales for the entire store.
Meta alone claims more revenue than the whole store made.
This is not a bug, and Meta is not lying. Meta and Google count conversions in fundamentally different ways, and Meta's default settings are the most generous in the entire ad stack. If you make budget decisions by comparing the two dashboards directly, you are comparing apples to a fruit basket that also includes apples someone else already paid for.
This post breaks down exactly how Meta, Google, and Enalitica each count conversions, why different attribution windows and view-through rules mean the numbers never match, and which one to trust when deciding where to put the next €1,000. If you want the one number that sidesteps this whole mess by dividing real revenue by real spend, read our guide to blended ROAS and MER.
How Meta, Google, and Enalitica Count Conversions: The Short Version
- Meta counts a conversion if the user saw an ad in the last 1 day, engaged with one (like, comment, save) in the last 1 day, or clicked a link in the last 7 days. View-through and engage-through conversions are mixed into the same number as click-through conversions. Meta has no idea what Google did, so the same order can be claimed by both.
- Google Ads counts a conversion when the user actually clicked (
gclid,gbraid, orwbraid) and converted within the attribution window. View-through conversions exist but live in a separate column. Data-Driven Attribution splits credit across touchpoints instead of giving 100% to the last ad. - Enalitica counts conversions only on real WooCommerce or Shopify orders, using first-party click IDs and reconstructed session journeys. There is no view-through. One order has one revenue figure, distributed across the channels that actually appeared in the customer's path.
The rest of this post is the detail behind those three sentences.
How Meta Counts Conversions
Meta's attribution windows in 2026: click, engage, and view
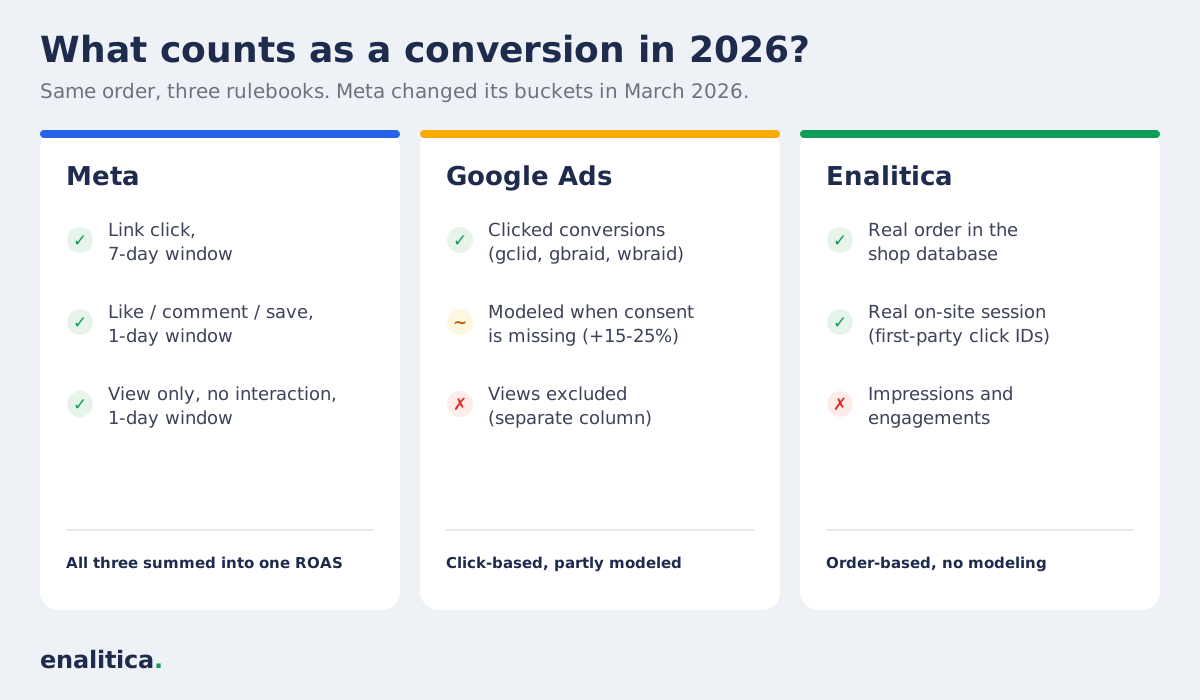
Meta's default conversion attribution window in 2026 is "7-day click, 1-day engage, 1-day view". Unless someone in your account has explicitly changed it, this is what every Meta dashboard, ROAS column, and CAPI report you read is showing you.
- 7-day click: if the user clicked a link in any of your ads in the last 7 days and converts now, Meta claims credit.
- 1-day engage-through: if the user liked, commented on, saved, or otherwise interacted with an ad (without clicking through) in the last 1 day, Meta also claims credit. This bucket is new: Meta introduced engage-through attribution in March 2026 and simultaneously narrowed "click-through" to link clicks only. Before that, a like or a comment counted as a full 7-day click.
- 1-day view: if the user just saw (was served, scroll-passed, briefly viewed) any of your ads in the last 1 day and converts now, Meta claims credit too, even with no interaction at all.
The March 2026 change is a real improvement in labeling honesty (a like five days before purchase no longer counts as a "click"), but the default total is still click + engage + view stacked into one Results column. The engage and view buckets remain on by default, and that is where the inflation lives.
Before 2021, Meta reporting commonly used an even longer 28-day click window. After Apple's App Tracking Transparency rules arrived with iOS 14.5, the click window shrank to 7 days, but the view-through part stayed on by default. Check the attribution setting on your own ad sets to see which window each one uses.
The size of the gap shows up in real orders. Over the last 90 days to 28 September 2026, Enalitica's data covers more than 10,000 orders and over €700,000 in revenue in stores with both Meta and Google Ads connected, and there Meta reported 4.6 times as many conversions as there were orders carrying its click ID. Part of that gap is the view and engage buckets, part is click capture missing visitors who declined consent.
Run the same comparison on your own store, one month, three numbers:
How much of your sales do Meta and Google claim?
Take last month. Enter the orders from your store and the purchases Meta and Google each report for the same month. Each platform counts by its own rules and neither knows what the other reported; the gap only shows up when you put them side by side.
Optional: the same in euros
Nobody is lying. Four reasons for the gap
- Meta also counts people who only saw the ad and bought within a day, without clicking.
- Google counts purchases up to 30 days after a click; Meta defaults to 7. The same buyer can sit inside both windows.
- A buyer who clicked a Meta ad on Tuesday and a Google ad on Thursday is one sale and two conversions.
- Orders from your newsletter, organic search and direct visits are in your total, and the platforms still claim some of them.
Where to find the numbers
- Store: WooCommerce: Orders, filter the month, subtract cancelled. Shopify: Analytics, Total orders. ERP: booked orders.
- Meta: Ads Manager, set the date range to the month, Purchases column in the Totals row. Leave the default attribution setting.
- Google Ads: Campaigns, set the date range to the month, Conversions column; with several actions, segment by conversion action and take purchase.
- GA4: Reports, Monetization, Ecommerce purchases, or the purchase event under Events.
This tool shows how big the gap is. It cannot show which orders.
Enalitica reads the click behind every order and gives each order one channel, once. Meta's number, Google's number and your orders sit on one screen and add up to your real revenue. Setup takes 5 minutes, 14 days free, cancel anytime.
Start 14-day free trialEverything runs in your browser; nothing you type leaves the page. Benchmark figures come from Enalitica's data, described on How we measure.
The good news is you can switch your reporting view to click-only without changing how Meta optimizes your campaigns.
How to switch your Meta reporting to click-only
There are two places "attribution" lives in Meta Ads Manager. Only one is the right thing to change.
| ✓ Right move | ✗ Wrong move | |
|---|---|---|
| What you change | Reporting comparison column | Per-ad-set attribution setting |
| Where it lives | Ads Manager → Columns → Compare Attribution Settings | Ad set edit → Conversion → Attribution setting |
| Effect on bidding | None, algorithm still gets the full signal | Degrades optimization, especially retargeting |
| Effect on dashboard | ROAS narrows toward reality | ROAS narrows but campaigns may underperform |
| Recommended | Always | Only if your media buyer asks for it |
The right move, step by step:
- Open any campaign, ad set, or ad view in Ads Manager.
- In the toolbar above the data table, click Columns → Compare Attribution Settings (in some accounts this is a small clock icon labeled Attribution).
- Pick 7-day click as the comparison window. Uncheck 1-day view and any other view-based options.
- Apply.
The Results, Cost per Result, and Purchase ROAS columns now reflect click-only attribution. Compare those numbers to your Enalitica or Google Ads reporting and the gap narrows significantly. You haven't changed the bidding signal at all, just what the dashboard shows you.
When the view-through inflation is removed from reporting, the gap between Meta-reported ROAS and our click-attributed ROAS in Enalitica narrows, but it rarely closes completely. The remaining inflation is cross-device click attribution and Meta's own modeled conversions, not view-through stacking. Why the gap peaks on retargeting and Advantage+ campaigns is explained in its own guide.
What "view-through" actually means
A view-through conversion is a conversion where the user:
- Was served an ad impression at some point in the last 24 hours.
- Did not click on it.
- Found your site through some other channel: Google search, direct, email, organic social, even a different ad platform, and bought.
Meta still credits that order to itself.
In practice, this means Meta is claiming credit for orders that came from Google Ads, organic search, email, or word-of-mouth, as long as Meta managed to serve an impression somewhere in the user's feed in the previous day. For high-frequency retargeting campaigns on warm audiences, almost every buyer has seen at least one Meta impression in the last 24 hours, so Meta ends up taking credit for most of the store's conversions regardless of where they actually came from.
Meta does not deduplicate against other platforms
Meta has no idea what Google Ads, TikTok, or organic search did for that order. It looks at its own pixel and CAPI signal, applies its own attribution window, and decides credit based purely on its own data. Google does the same on its side. So the same order can be:
- Claimed 100% by Meta (because there was a 1-day view-through impression).
- Claimed 100% by Google Ads (because there was a
gclidclick 3 days earlier). - Claimed 100% by GA4 (last non-direct click).
Add up the dashboards and the double counting becomes visible. In Enalitica's data, last 90 days to 28 September 2026, Meta and Google Ads together reported 10,453 conversions against 10,458 orders in the stores' own databases, worth about three quarters of all store revenue, including orders that came from email, organic search and direct.
Meta and Google Ads claimed as many conversions as the stores had orders in total. Across more than 6,500 order journeys in Enalitica's data, only 33.3% of orders had a paid ad click anywhere, and only 1.4% touched two or more ad platforms.
That data discrepancy is not a tracking bug. It is double counting built into each platform's attribution rules.
iOS 14.5+ and Meta's modeled conversions
Since iOS 14.5, apps must ask for permission before tracking users across other companies' apps and websites (Apple: user privacy and data use), and many iPhone users say no. Meta's response was to fill the gap with statistical modeling: for the conversions it cannot directly observe, it estimates how many "should" have happened based on aggregate patterns and surfaces them as "modeled conversions" that look identical to real ones in the dashboard.
This is mathematically reasonable at the platform level but unverifiable at the campaign level. You cannot tell which line in your campaign report is a real order with an fbp cookie behind it and which is a modeled estimate.
Conversions API helps because it sends server-side events Meta can match deterministically. We covered the full setup in Meta Conversions API: The Complete E-Commerce Guide. If you run CAPI through server-side GTM, see our comparison of three setups beyond the default Meta CAPI tag. But CAPI does not change attribution rules. It just gives Meta a stronger signal to apply the same generous rules to.
Meta Incremental Attribution: causation measured, and graded, by Meta
In April 2025 Meta added an Incremental Attribution setting: instead of asking "did this buyer see or click an ad?", it models whether the purchase would have happened without the ad, by comparing exposed and unexposed users. You can view it as a comparison column (Columns → Compare Attribution Settings → Incremental Attribution) without touching delivery, or select it as the optimization goal, which locks the attribution setting entirely.
Two numbers to hold side by side. In Seer Interactive's test on $1M of ad spend, Meta reported that on average 87% of the agency's conversions were incremental, while GA4 pointed to about 67%, a roughly 20-point gap between Meta's self-reported incrementality and what an outside tool could verify.
Our read: the setting is directionally useful (a campaign whose incremental column collapses to near zero deserves scrutiny), but it is still Meta modeling Meta, with no external control group you can audit. A campaign-pause holdout on your own orders remains the only incrementality number you can defend in a budget meeting.
Why Meta ROAS feels real
It feels real because the orders are real. Meta is not inventing transactions. It is over-claiming credit for transactions that other channels already drove. The trap is mistaking "Meta says it drove this order" for "Meta caused this order."
How Google Ads Counts Conversions
Google Ads counts only clicked conversions by default
Google Ads' headline conversion column is click-based. To get credit, Google needs a click that produced a gclid, gbraid (documented for iOS 14.5+ clicks, usually next to a gclid), or wbraid (clicks on ads inside Google's own iOS apps). We broke down the differences in GCLID vs GBRAID vs WBRAID.
If the user only saw an ad and didn't click, the conversion is not in the main column. Google does report view-through conversions, but they live in a separate, optional column that most advertisers ignore. The default ROAS calculation excludes them.
Timing adds another quirk: Google Ads books each conversion on the date of the ad click, not the purchase date, so the most recent days always look weak until the conversion lag catches up.
Data-Driven Attribution splits credit across touchpoints
Google Ads uses Data-Driven Attribution (DDA) as the default model for most conversion actions. DDA uses machine learning to split credit across touchpoints. A search journey might assign 0.3 to a generic keyword that started the journey and 0.7 to the branded keyword that closed it. Single-touch credit gets diluted compared to last-click. Google's official attribution model documentation explains how this works.
Last click is still available if you choose it, while first click, linear, time decay and position-based models are no longer supported. Whichever model you pick, Google's main column stays click-only.
GA4 and Google Ads agree on click-based conversions
Google Ads conversions and GA4's "Google Ads" channel almost always agree. They share the same gclid join key and the same general philosophy: a conversion needs a click. Meta has no equivalent cross-check inside the Google ecosystem, which is part of why Meta's number can drift so far from reality without anyone noticing.
Consent Mode modeling adds conversions Google never observed
Google's headline column is click-based, but since Consent Mode v2 it is no longer purely observed. When a visitor declines cookie consent, Google models whether that click "probably" converted from aggregate patterns, and adds the estimate straight into the main conversions column. Google's consent mode documentation gives one advertiser example with an 18% conversion uplift from modeling and notes that consented users are typically 2 to 5 times more likely to convert than unconsented ones. Modeling only activates above a threshold of 700 ad clicks over 7 days per country and domain grouping, so small accounts see none of it and mid-size accounts see it switch on and off.
Two consequences. First, the modeled share is invisible: nothing in the column marks which conversions carry a real gclid-to-order match and which are statistical estimates, so the gap between Google's number and your order database widens as consent rates drop. Second, modeling amplifies whatever your setup already does: the classic mistake of importing the same purchase from both GA4 and a native Google Ads tag double-counts every real conversion, and the model then learns from the doubled baseline. If your Google Ads conversions exceed your shop's order count, check for the double import first, not for a tracking miracle.
It feels conservative because Google counts only what it can prove. A buyer who saw a YouTube ad, then Googled the brand name, then bought, gets attributed to "Branded Search" rather than to the YouTube impression that planted the seed. That is technically incomplete but commercially honest. Google is reporting a click, and the click happened.
The side effect: when you compare Meta and Google ROAS side-by-side for the same week, Meta wins by a huge margin even when its ads contribute less to actual revenue. Founders who don't know the rules behind the two numbers shift budget toward Meta and watch overall revenue stay flat or drop. The classic "ROAS goes up, business goes sideways" pattern.
How Enalitica Counts Conversions
Enalitica is built around three rules:
- Real orders only. The source of truth is the WooCommerce or Shopify order record, not the Meta pixel or the Google Ads conversion tag. If the order does not exist in the shop database, it does not exist in our reports.
- Click IDs over cookies. We attribute via
gclid,fbclid,gbraid,wbraid,ttclid,msclkid, and others, captured as first-party data at landing time and stored on our own domain. ITP, ETP, ad blockers, and third-party cookie restrictions do not break this signal. We covered the full capture mechanism in How to Capture GCLID and FBCLID in WooCommerce. - No view-through. A user must have actually visited the site (we have a session for them) for any channel to be eligible for credit. Impression-only attribution is excluded by design.
How Enalitica reconstructs each order's session journey
For every order we reconstruct the full session journey: which channel families touched the user across all sessions before the purchase. From that journey we classify the order:
- Direct: only one channel family appears in the journey. That channel gets full credit.
- Influenced (multi-touch): two or more channel families appear. The order is shown in each channel's tab as "influenced", and the cross-channel chart shows which other families co-touched.
This is the same rule for every channel: Meta, Google Ads, organic search, direct, email, referral. There is no special "Meta gets to claim view-throughs" carve-out. We dive deeper into the underlying methodology in Multi-Touch Attribution for E-Commerce, and the full landscape sits in our complete guide to ecommerce attribution.
How Enalitica's channel tabs and store summary add up
Two important nuances about Enalitica's numbers:
- Per-channel tabs are intentionally additive. An order on a multi-channel journey appears in every channel's "Influenced" count, once for Google Ads, once for Meta, once for Organic, etc. That is the point of the multi-touch view. Each channel can see the orders it actually contributed to.
- The store-level summary is intentionally deduplicated. The headline "total revenue" number assigns each order to a single primary channel (the last click before purchase) so the totals across channels sum to real shop revenue.
If you sum the per-channel "Direct + Influenced" numbers expecting them to equal the store total, they won't, and shouldn't. Multi-touch reporting is additive by design; the summary is deduplicated by design.
Why Enalitica ROAS is lower than Meta's by design
Because Enalitica excludes view-through and ties credit to a real session, its per-channel ROAS numbers will almost always be lower than Meta's and similar to or slightly higher than Google's. In customer reviews this is the single biggest source of "wait, why is Enalitica ROAS lower than Meta?" The rest of this post is the answer.
What Enalitica sends back to Meta and Google
We send our verified, deduplicated conversions back to Meta (Conversions API) and to Google (Enhanced Conversions / offline conversions) so the bidding algorithms still get a strong signal. The platforms get accurate optimization data; the dashboards still report whatever they report. This is intentional. We do not try to fix Meta's reporting. We just stop relying on it for spend decisions.
Worked Example: Meta, Google, and GA4 vs Actual Shop Revenue
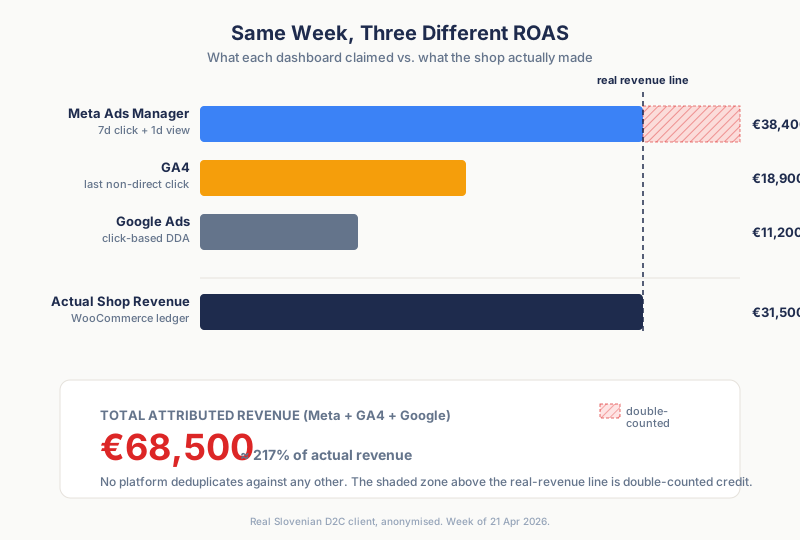
Illustrative example, one week, rounded numbers that show the mechanism rather than any one store:
| Source | Reported revenue | Reported ROAS |
|---|---|---|
| Meta Ads Manager (default 7d click + 1d engage + 1d view) | €38,400 | 8.0 |
| Google Ads dashboard (DDA, click-based) | €11,200 | 3.7 |
| GA4 (last non-direct click) | €18,900 | N/A |
| Actual shop revenue (WooCommerce) | €31,500 | N/A |
| Enalitica Reports, Meta tab | €8,950 direct + €4,200 influenced | 2.7 / 4.0 incl. influenced |
| Enalitica Reports, Google Ads tab | €9,300 direct + €3,800 influenced | 3.1 / 4.4 incl. influenced |
Three things to notice:
- Meta + Google + GA4 attributed €68,500 of revenue. Real revenue was €31,500. Roughly half of all reported attribution is double-counted.
- Meta's standalone €38,400 is more than the entire store made that week. That is only mathematically possible because of view-through stacking.
- Enalitica's Meta-direct ROAS (2.7) is in line with Google's reported ROAS (3.7). When both sides use comparable click-based logic, they agree. The huge Meta dashboard number is the outlier, not the small Enalitica number.
Why Meta and Google Report More Conversions Than Real Orders
Part of the surplus is modeled: estimated conversions for visitors the platforms could not observe, blended into the same column as measured ones. We unpacked that mechanism separately in modeled conversions vs real orders.
Mathematically, here is what happens. For any given order:
| Question | Meta answer | Google answer | Enalitica answer |
|---|---|---|---|
| Does an ad impression in the last 24h count? | ✓ | ✗ | ✗ |
| Does a like or comment in the last 24h count? | ✓ | ✗ | ✗ |
| Does a click 7 days ago count? | ✓ (link clicks) | ✓ (within window) | ✓ (within window) |
| Do we check what other platforms did? | ✗ | ✗ | ✓ |
| Do we deduplicate against the actual order? | ✗ | ✗ | ✓ |
| Do we model missing data? | ✓ | Partially | ✗ |
Meta and Google each operate as if they are the only platform that exists. Enalitica operates as if the order is the only thing that's real and platforms are competing for credit on it.
When every platform claims orders independently, total reported attribution runs ahead of the orders behind it. The worked example above is what that looks like in a single week.
How Double Counting Should Shape Your Ad Budget Decisions
A few practical takeaways from the stores we measure, which run into this exact double-counting pattern.
Don't pause Google because Meta's ROAS looks better
They are not measuring the same thing, and Meta's headline number is best understood as a ceiling rather than a point estimate.
A Meta ROAS on default attribution settings is an upper bound, not a forecast. The number to budget on is what remains when you count only orders with a real Meta click.
How far below the ceiling the true number sits depends on the audience: retargeting on warm audiences inflates the most, broad prospecting the least. Often Meta is still a profitable channel, just not a magical one.
Use one common ledger for budget shifts
Comparing channel A's ROAS to channel B's ROAS only works if both numbers were calculated the same way. Either compare two click-based numbers (Google dashboard vs Enalitica Google tab) or two order-based numbers (Enalitica Google tab vs Enalitica Meta tab). Don't compare Meta dashboard to Google dashboard. Different definitions, different scales.
Pause on the profit pair, not on revenue alone
Even an honestly measured ROAS still compares revenue to spend. Enalitica also shows POAS (profit on ad spend: revenue minus product costs, shipping, payment fees and packaging, divided by spend) for every campaign, and it comes as the same direct plus multi-touch pair as revenue. Direct POAS counts only the orders the campaign closed; MT POAS adds the profit of every order it assisted. Before pausing anything, check both: a campaign below 1.0 on direct but above it on MT POAS is feeding profitable orders that other channels close, while a campaign below 1.0 on both is genuinely buying revenue at a loss no matter what its ROAS says.
Keep CAPI and Enhanced Conversions on
Bad reporting and good optimization signal can coexist. The platforms still need accurate event signal to bid well. You just don't need to read their dashboards as gospel afterwards. CAPI improves Meta's bidding accuracy without forcing you to trust Meta's view-through math.
For incrementality, run holdouts
Even Enalitica's number is correlation, not causation. A geo holdout, a campaign-pause experiment, or a Meta lift study is the only way to measure whether Meta is causing sales, not just touching them. We can build the journey reconstruction. We can't replace experimentation.
Don't compare cross-channel to a 100% target
If your dashboards add up to more than your actual revenue, that is normal. The fix is not to "find the missing 80%". It is to pick one source of truth and stop adding the others to it.
When to Trust Meta, Google Ads, GA4, and Shop Dashboards
A short field guide for the next time you open Ads Manager.
| Dashboard | What you're actually looking at | When to trust it |
|---|---|---|
| Meta Ads Manager (default) | 7d click + 1d view, no cross-platform dedup, partial modeling | Bidding signal, not budget allocation |
| Meta Ads Manager (7d click only) | Click-based Meta credit, no view-through inflation | Closer to reality, still walled garden |
| Google Ads conversions | Click-based with DDA, view-through in separate column | Generally reliable for Google channel ROI |
| GA4 Acquisition Reports | Last non-direct click, explorations can be sampled above 10 million events | Trend direction; absolute numbers degrade with consent loss |
| Shop / WooCommerce dashboard | Actual orders and revenue | Always. This is the only number that came from a payment processor |
| Enalitica Reports | Order-based, click-ID-anchored, channel-deduplicated | Spend decisions and channel comparison |
GA4's gap is measurable. Set GA4's purchase events against the stores' own order books in Enalitica's data (more than 10,000 orders, stores where both are connected, last 90 days to 28 September 2026) and GA4 accounts for 76.6% of the orders the stores actually had; in the median store the share drops to 68.5%. Data-sampling limits in Google's GA4 documentation come on top of that.
Meta and Google dashboards are useful. They are not wrong about what they see. They are wrong as a source of truth because they each see only their slice and assume the rest of the world doesn't exist.
One thing we keep seeing across our clients deserves saying here, because last-click numbers put Meta in a harsher light than it earns: when a store invests seriously in Meta, its organic and direct traffic rise with it, brand searches multiply, and orders arrive days later through channels Meta never gets credit for.
What the journeys can see directly is narrower. In Enalitica's data, last 90 days to 28 September 2026, Meta appeared earlier in the journey without being the last touch in 16.3% of the orders it touched, against 26.7% for Google Ads and 35.6% for email. We can see the lift; we cannot measure how much of it is Meta's, and neither can anyone honestly. Read the Meta row as a floor, not a verdict; the Meta halo guide explains what we see and why nobody can size it.
How Enalitica Reports Deduplicate Conversions Across Channels
Enalitica's Reports (Poročila) page is built specifically for the comparison problem this post describes.
Enalitica's one ledger: direct and influenced revenue per channel
Each channel tab (Google Ads, Meta Ads, Organic, Social, Email, Direct) shows the same two columns:
- Direct revenue: orders where this channel was the only one in the journey.
- Influenced revenue: orders where this channel touched the user but a different channel was the converting session.
Both numbers are derived from the same order list. If you click a campaign or keyword row, you see the actual orders, with order numbers, customer city, products, and totals. No black-box modeling, no view-through impressions, no double-counting against other platforms.
The same direct-plus-multi-touch pair also exists for profit: campaign tables show POAS (profit on ad spend, after product costs, shipping, payment fees and packaging) next to ROAS, as direct POAS and MT POAS. Revenue tells you which campaign sells; the profit pair tells you which one earns.
How Enalitica anchors attribution to first-party click IDs
For paid channels, Enalitica anchors attribution to first-party click IDs captured at order time. A gclid captured in WooCommerce order metadata in February is still attributable in May, regardless of cookie state, ITP, or ad blockers. We covered the validity windows and capture mechanics in detail in GCLID vs GBRAID vs WBRAID and How to Capture GCLID and FBCLID in WooCommerce.
Keyword-level revenue per order
For Google Ads orders, we enrich each order with the exact campaign, ad group, keyword, match type, ad creative, and average CPC that drove the click. The Google Ads tab shows revenue grouped by campaign, then by keyword, with each keyword expandable to the actual orders.
That means the question "which exact keyword paid for itself this month?" has a real answer, not a campaign-level approximation.
Why Enalitica attribution survives consent loss and ad blockers
| Privacy event | GA4 attribution | Order-based attribution |
|---|---|---|
| User declines cookie consent | Lost | Captured (click ID in WooCommerce metadata) |
| Safari ITP purges cookies after 7 days | Lost for delayed purchases | Captured (server-side at order time) |
| Ad blocker blocks GA4 | Lost | Captured (orders synced from shop database) |
| GA4 JavaScript fails to load | No event fired | Order still exists with full attribution |
This is the structural reason order-based attribution holds up where event-based attribution decays. The event might not fire. The order always exists.
If your team is currently shifting budget based on Meta dashboard ROAS and you suspect the numbers feel optimistic, this is exactly the gap Enalitica closes. Book a demo and we'll walk through your last 30 days of orders together, comparing what each platform claims to what the shop database actually shows.
Conversion Tracking Checklist: Five Fixes This Week
Five things you can do this week, in order of effort.
- Open Meta Ads Manager and change the default attribution setting on one ad set. Ad set → Conversion → Attribution setting → 7-day click only. Run it for a week. Compare the new ROAS to the old one. The drop is the size of your view-through inflation.
- Stop comparing Meta dashboard ROAS to Google dashboard ROAS. Pick one source of truth (preferably an order-based one) and use it for both.
- Capture GCLID and FBCLID server-side at order time. WooCommerce's built-in order attribution stores UTM source and medium on the order, not the click IDs themselves, so you need a click ID capture plugin or snippet. This is the foundation everything else builds on.
- Turn on CAPI for Meta and Enhanced Conversions for Google. This improves bidding regardless of how you measure ROAS. See our Meta CAPI guide for the deduplication settings.
- Run a campaign-pause holdout once per quarter. Pause your top Meta campaign for 7 days. Watch what happens to total shop revenue, not Meta-reported revenue. The delta is the closest thing to a real incrementality number you can produce without geo experiments; the full protocol for an honest pause is in our advertising incrementality guide.
Frequently Asked Questions
Should I trust Meta-reported conversions or GA4 numbers?
Neither, as an absolute count. Trust each for what it measures well: Meta's number tells you which of its own campaigns and creatives perform relative to each other, GA4's number gives you a consistent (if incomplete) view across channels. For the absolute count of orders and revenue, trust your store's order database, it is the only system that recorded every sale. That is the number your bank statement will agree with, and it is the baseline both dashboards should be judged against. On Shopify the order database even knows a fair bit about the source already; we broke down exactly what in our guide to Shopify attribution.
Should I just disable view-through attribution in Meta?
Yes for reporting, no for optimization. Change the reporting comparison column to 7-day click (steps in How to switch your Meta reporting to click-only above) and you get honest numbers without touching how Meta bids. Don't turn off view-through events at the ad set level or stop sending them to Meta entirely, that degrades the algorithm's learning signal and your campaign performance can drop.
Why does my GA4 number disagree with both Meta and Google?
GA4 uses last non-direct click by default for its standard reports. If a user clicked a Meta ad two weeks ago and came back via direct yesterday, GA4 credits the Meta channel as the last non-direct touchpoint, but Meta's 7-day click window would have already expired. Different attribution windows, different counting rules. GA4 is also subject to consent loss and ad blocker decay, so its absolute numbers should be treated as directional, not authoritative.
Is Meta's view-through attribution useful for anything?
Yes, for one specific question: "did anyone who saw this campaign convert at all?" View-through is a soft signal that helps with prospecting campaigns where you expect long, indirect journeys. It is not useful for headline ROAS comparison or for deciding how to split budget across paid channels. Treat view-through as a separate column you check occasionally, not as part of the conversion total you pay attention to daily. We break down exactly where view-through hides in both platforms' reports in how view-through conversions inflate ROAS.
What is Meta engage-through attribution?
Engage-through attribution is a conversion bucket Meta introduced in March 2026 for users who interacted with an ad (like, comment, save, video engagement) without clicking its link, and converted within 1 day. At the same time Meta narrowed "click-through" to link clicks only; previously any interaction counted as a click with a full 7-day window. The default ad set setting is now 7-day click, 1-day engage, 1-day view, all summed into one Results column. For honest reporting, compare the click-only column against the total; the difference is what engagement and impressions are claiming.
Can Google Ads also over-attribute the way Meta does?
Yes, but less aggressively. Google Ads can over-attribute when a user sees a Display ad they don't click, then searches for your brand and buys. The Display impression gets recorded as a view-through conversion but is reported in a separate column, not the main one. So the headline number stays clean. The over-attribution potential exists; it's just not embedded in the default ROAS column.
Why doesn't Meta + Google + Enalitica add up to total shop revenue?
They will if you compare the right numbers. Meta and Google don't deduplicate against each other, so adding their dashboards always produces a bigger number than reality. Enalitica's per-channel "Direct + Influenced" view is also intentionally additive (each channel sees orders it touched). The number that does add up to total shop revenue is Enalitica's deduplicated store-level summary, which assigns each order to one primary channel (the last click before purchase). Use the additive view for "did this channel contribute?" and the deduplicated view for "where did this revenue come from?".
Does Chrome's Privacy Sandbox change order-based attribution?
No. In October 2025 Google retired Topics, the Attribution Reporting API and most other Privacy Sandbox technologies, and third-party cookies stay in Chrome as a user choice. Order-based attribution never relied on third-party cookies anyway. The platform dashboards (Meta and Google) keep leaning on modeling as consent rates fall, so the gap between dashboard ROAS and click-attributed ROAS is more likely to widen than narrow. The further the platforms move into modeled-conversion territory, the more important an order-based ledger becomes as the sanity check.
What if I run mostly retargeting on Meta?
Retargeting amplifies the over-attribution problem. By definition, your retargeting audience has already visited the site, which means another channel almost certainly drove the original visit. When the user comes back and buys, Meta's view-through window claims credit for an order someone else (organic, direct, email) actually set up. If you run heavy retargeting, expect the gap between Meta-reported ROAS and the click-attributed number to be widest on exactly those campaigns. Switch reporting to "7-day click only" to see what retargeting is actually contributing on top of the channel that originally brought the visitor.
Does Enalitica replace GA4?
No, it complements GA4. GA4 is great for session-level behaviour (scroll depth, video engagement, on-site funnel) and Enalitica is great for order-level revenue attribution. We pull GA4 data into the Reports view as enrichment, but the order is always the source of truth. If GA4 is missing, the order still gets attributed using its WooCommerce or Shopify metadata.
Sources
The outside pages this article relies on. Links checked on 28 September 2026.
- Meta introduced engage-through attribution in March 2026 (facebook.com)
- App Tracking Transparency rules (developer.apple.com)
- Seer Interactive's test on $1M of ad spend (seerinteractive.com)
- Google's official attribution model documentation (support.google.com)
- consent mode documentation (support.google.com)
- Google's GA4 documentation (support.google.com)
- order attribution (woocommerce.com)
- October 2025 Google retired Topics, the Attribution Reporting API and most other Privacy Sandbox technologies (privacysandbox.google.com)
Figures marked "in Enalitica's data" are aggregates from the real orders of the stores we measure, with no names and no individual orders. How we measure.
See your real numbers
Import 30 days of orders or leads during a 5-minute onboarding. Works for e-commerce and service businesses.
See plans and pricing