
Advertising Incrementality: What Would Sell Without the Ads
Advertising incrementality asks what would sell without the ads. The eBay and Airbnb experiments, test limits for small stores, five signals from orders.

Tilen Ledic
Written by
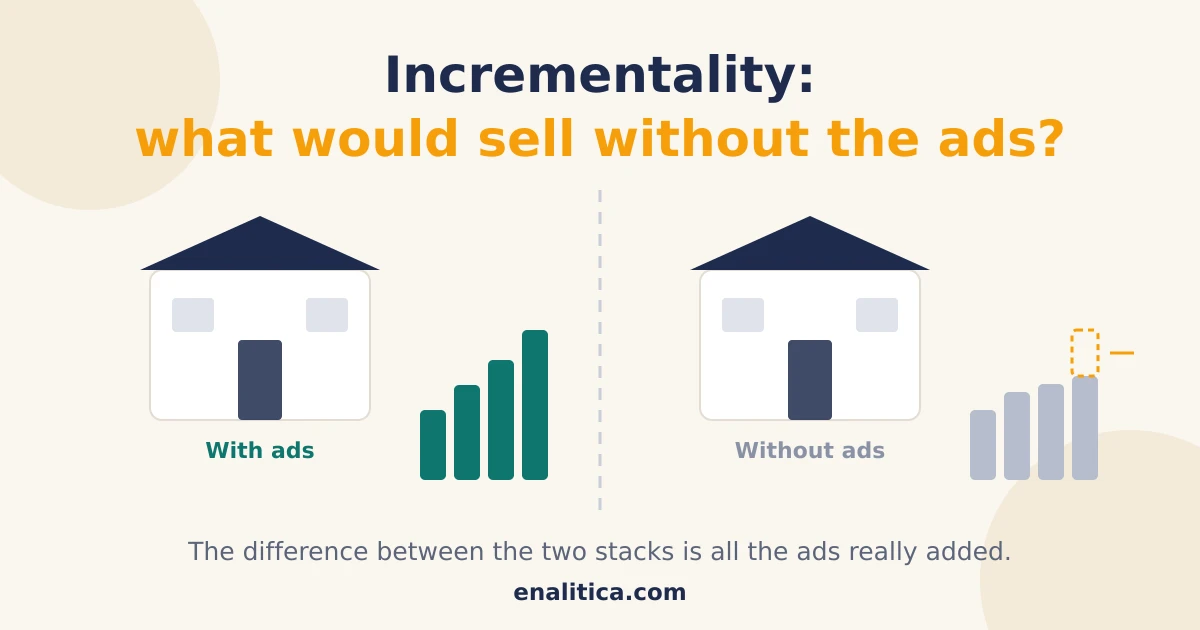
Advertising incrementality is the question ROAS cannot answer: how much of your revenue did the ads CAUSE, and how much would have happened anyway.
The question is not academic. The largest published experiment found that 99.5% of clicks on brand ads would have arrived without paying, while Google's own meta-analysis found that for the average advertiser most paid clicks are incremental; the truth depends on WHAT you advertise.
This guide explains what the big experiments showed, why a small store cannot measure incrementality with a proper test, and which five signals from your own orders honestly illuminate the question anyway. Sources checked August 16, 2026; the eBay, Google and Lewis and Rao papers are linked below.
Advertising incrementality vs attribution: the difference
Advertising incrementality measures cause: how much revenue would not exist if the ad had not run. Attribution measures connection: which order arrived through which click. The difference is fundamental, because perfect attribution still does not answer "would this buyer have bought without the ad". A click on a brand ad is perfectly traceable and often barely incremental: the buyer had already typed your name.
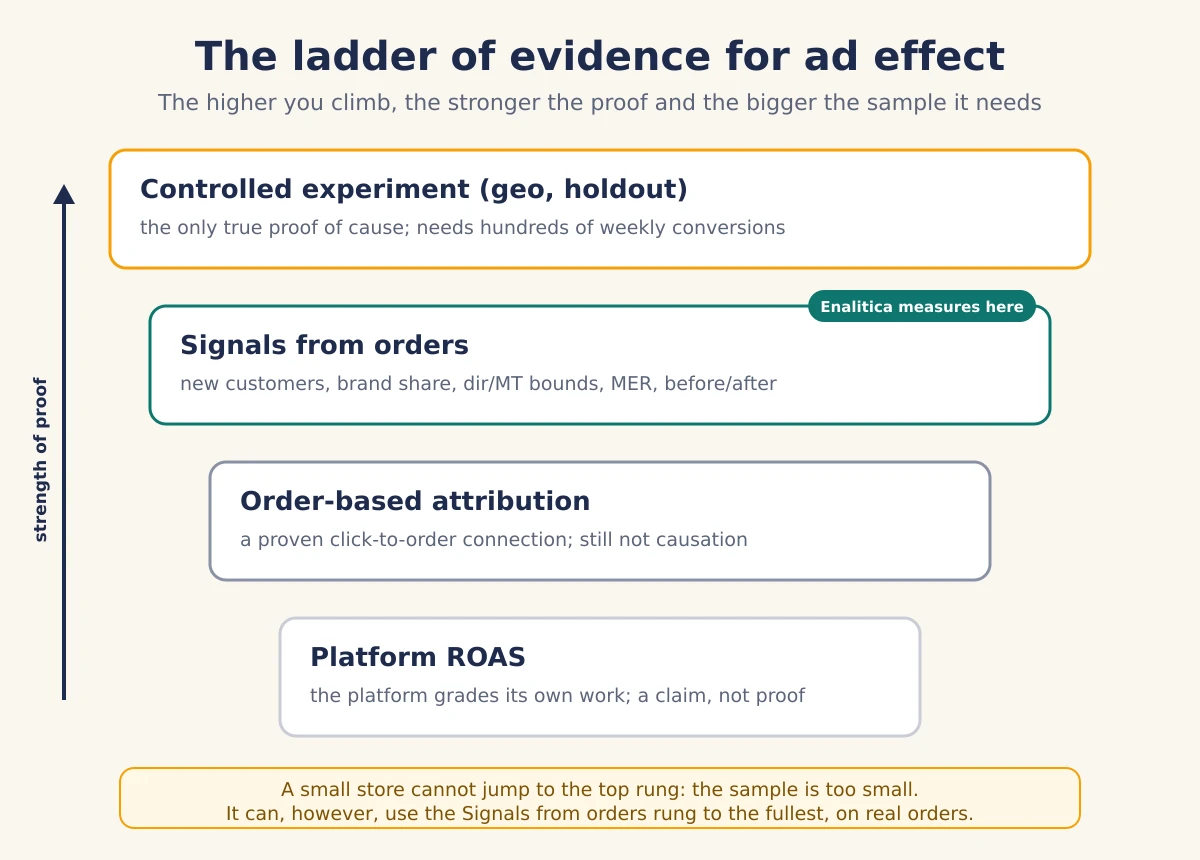
The gold standard for measuring cause is a controlled experiment: part of the audience or part of the regions sees the ads, part does not, and the difference in sales is the incremental effect. Such an experiment demands statistical power a small store does not have, as the next sections show.
Enalitica therefore takes a different, honest approach: where cause cannot be proven, we show a lower and an upper bound. For customer acquisition cost (CAC) we literally print both numbers, direct and multi-touch, with the note that the truth sits between them.
One "precise" number would be a lie; an interval is honesty. That idea, bounds instead of a lab, is the thread running through this article.
The big experiments: eBay, Airbnb and Google's answer
Three large experiments set the frame for any serious conversation about ad incrementality. The first is eBay's (Blake, Nosko and Tadelis, published in Econometrica in 2015): eBay stopped paid ads on brand keywords and measured that 99.5% of the clicks came back through organic results.
For non-brand ads the average return was negative, and a positive effect appeared in exactly one segment: new and infrequent buyers. Remember that last part, because it returns in every chapter of this article.
The second is Airbnb: in 2020 it stopped most of its performance advertising (around half a billion dollars a year) and traffic returned to roughly 95% of the prior level, which convinced management to permanently shift part of the budget to brand. The company described the shift in its 2020 IPO filing and in the earnings calls that followed; the 95% figure is management's own, not an independent measurement.
And the third is Google's answer to eBay: a meta-analysis of Search Ads Pause studies by Google's own researchers (Chan, Yuan, Koehler and Kumar, 2011, with a 2012 follow-up on organic rank) across many advertisers measured that organic does not replace 89% of paid clicks on average, and even for advertisers holding the top organic position, about half of the paid clicks are incremental.
All three studies can be true at once: eBay measured the brand of a global giant, Google measured the average advertiser. The lesson is not "ads do not work" but "incrementality is a property of the campaign, not the channel": brand searches are the least incremental, which is why bidding on your own brand name deserves its own audit, and new customers are the most.
Why can't a small store measure incrementality with a test?
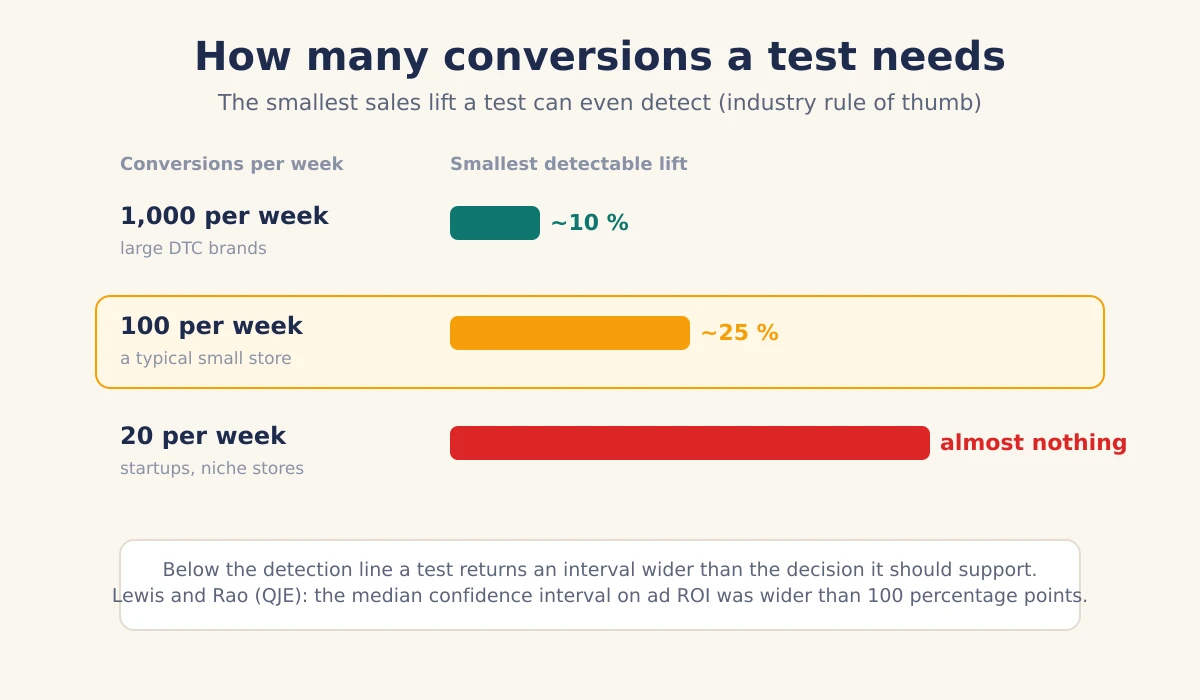
A small store cannot measure incrementality with a test because it runs out of statistical power: sales are too noisy and the signal is too small. Economists Lewis and Rao analysed 25 large experiments in the Quarterly Journal of Economics (2015) (most reached millions of customers) and found the median confidence interval on advertising ROI was wider than 100 percentage points.
Even with millions of impressions you often cannot tell whether the return was -50% or +50%. By their arithmetic, an informative experiment can require ten million person-weeks of data.
A rough rule of thumb used by the people who run these tests, and one we have not seen formally published: a store with roughly 1,000 conversions per week can reliably detect a 10% lift, while a store with 100 conversions per week only detects changes above 25%. A typical small store sits in the second group or below it, and small markets are too interconnected for clean geo tests anyway.
This is why we do not sell incrementality-testing tools, and why our Northbeam alternatives comparison already stated that MMM and testing tools below roughly $100,000 of monthly ad spend do not pay for themselves: below that line the test eats the budget and returns an interval wider than the decision it was meant to support.
The numbers simply do not add up at that size; what a small store can do instead follows in chapter five.
Meta incremental attribution and Google's lift tests
The platforms have noticed the incrementality question and offer their own answers. In April 2025 Meta introduced the "incremental attribution" setting: a model built on its holdout studies that reports only the conversions Meta estimates the ad caused, and can also optimize delivery toward them.
In its own announcement Meta quoted 46% more incremental conversions across 37 lift studies when campaigns optimized for incremental outcomes; that is Meta's figure about Meta's feature. Google offers conversion lift tests through account representatives, and Meta's Brand Lift studies come with a minimum spend that in most markets puts them out of reach of a small store, which tells you who they are built for.
These tools are a useful signal and real methodological progress. One thing has not changed: the platform is grading its own work. Meta's "incremental" column is Meta's model of Meta's ads, built on data only Meta sees, and nobody outside can verify it.
The platforms already disagree with each other when counting ordinary conversions; modelled causation leaves even more room for generosity, much like view-through conversions. The only independent judge is a number no platform can inflate: the sales in your own store.
Five incrementality signals in your own orders
Five signals from real orders honestly illuminate incrementality without a single test. None of them proves cause; together they tell you which end of the interval the truth is on. We list them with the exact definitions Enalitica computes, because the details are what separate signal from decoration:
- New-customer share per campaign. A customer is new when the order is their first in the store's ENTIRE history (compared by hashed email). The number only prints once at least 30% of orders carry an email; below that threshold every buyer would look "new" and the number would be fiction. eBay's experiment showed ads worked only on new buyers: a campaign with a high new-customer share is probably incremental, a campaign selling to returning customers is probably overpaying for purchases that would have arrived on their own.
- Brand share of the campaign's clicks. We count only clicks on search terms Google names (minimum 15), and never declare unnamed terms non-brand. A campaign without "brand" in its name that has 40% or more of its clicks on your own name is harvesting demand that would have arrived anyway.
- The lower/upper bound pair. POAS and CAC are shown direct (last proven click only) and multi-touch (every channel that provably touched the journey); MT never sums across channels. A campaign weak on BOTH measures is weak for real; a campaign weak direct but strong MT is assisting, and killing it on last click is a mistake, as assisted conversions explain in detail.
- MER against your own break-even. Total revenue against total spend, with the break-even line computed from YOUR margins (1 divided by contribution), not from industry averages; details in the blended ROAS and MER guide. If campaign ROAS keeps rising while MER stands still for years, the campaigns are passing the same sales to each other.
- Before/after around every change. Every decision is compared in equal windows before and after the change, with a ±15% dead band, because smaller movement is noise, not a result. How that becomes a verdict is the next chapter.
Incrementality answers whether the ads cause anything; the operational sibling question, when a single campaign has earned a pause, is answered with rules in when to pause a Google Ads campaign.
How Enalitica judges incrementality without a lab
Enalitica follows every decision you make as a small experiment. A budget raise or cut, a pause, a re-enable, a new campaign: each change gets equal windows before and after itself and a verdict at the 1, 7, 14, 21 and 28 day checkpoints: working, not working, mixed or too early, always with the reason in numbers (spend, orders, ROAS before and after) and a proposed next step.
A budget change above 20% triggers the warning that the platform's learning phase probably reset, so the first seven days are not judged. A drop in direct ROAS while multi-touch holds softens the verdict: the campaign assists, do not rush. And a pause of a campaign with multi-touch POAS above 1.0 is never even proposed, because it would kill sales that other channels close.
The novelty we are describing publicly for the first time in this article: since August 2026 a pause carries an account-truth check. When you pause a campaign, Enalitica also compares the store's TOTAL revenue in the same windows.
If it held up, the morning email honestly says the store does not miss the pause and the sales evidently arrived through other paths: the eBay scenario, measured on your own store. If total revenue fell 15% or more, you learn the same day that the campaign is a candidate for re-enabling, with the seasonality caveat attached.
That is the closest thing to an incrementality test a small store can get without a lab, and every such "experiment" is visible on the campaign's card in Campaign Health, with the same verdict as the morning email. To see this on your own campaigns, see plans and pricing or book a live demo.
How do you run a pause as an honest experiment?
You run a pause as an honest experiment by writing the rules BEFORE it, not after. The protocol we use ourselves:
- Criterion first, with a sample size. Write down when the pause gets reversed or confirmed, always with a sample: "if total revenue falls more than 15% after 14 days, the campaign goes back on". Enalitica checks entered criteria daily, but only once the sample is met; a criterion without a sample is guessing.
- Clean weeks. Change nothing else on the account during the experiment; one experiment at a time. Exclude weeks where anything else changed from the judgement.
- Watch both numbers. The campaign's own column will always look like a catastrophe after a pause; the question is total revenue and channel revenue. A campaign dropping while the account holds is substitution, not loss.
- Seasonality. A same-month-last-year comparison is only fair with at least 12 months of history; September against August is a calendar, not an experiment.
- Pause, never delete. A paused campaign keeps its history and can be reversed; a deleted one cannot. And before pausing anything, check the three conditions our system also demands: a clear loss (POAS below 0.5), at least three clean weeks, and enough spend that the number is not chance, and never pause a campaign that provably assists. Once an experiment shows a campaign truly earns money, scale it by the scaling rules, not overnight.
Frequently Asked Questions
Is a high ROAS proof that the ads are incremental?
No. ROAS measures the connection between a click and a purchase, not the cause. The highest ROAS typically belongs to brand campaigns, which eBay's experiment found least incremental: the buyer was already searching for the name. To estimate cause, look at the new-customer share, the brand share and how total revenue behaves around changes.
What share of ads is actually incremental according to studies?
It depends on the campaign type. eBay measured near-zero incrementality on brand searches (99.5% of clicks would have arrived organically), while Google's pause meta-analysis measured around 89% incremental clicks for the average advertiser, and roughly half for advertisers holding the top organic position. For non-brand ads the effect is largest on new and infrequent buyers.
Should I turn off ads on my own brand name?
Not blindly. eBay's result belongs to a brand everyone knows; a small brand with aggressive competitors on its name can have different arithmetic. Check the brand share in your campaigns and Search Console: if you already own the top organic spot and nobody bids on your name, the brand budget is the first candidate for a pause run as an experiment.
When is a real geo incrementality test worth it?
When you have enough conversions for the test to detect anything: the industry talks about several hundred conversions per week per region, and spend levels where the holdout costs less than a wrong decision, typically millions per year. Below that threshold, the smarter path is order-level attribution plus a pause run as an experiment with a pre-written criterion.
Sources
The outside pages this article relies on. Links checked on 3 October 2026.
- Blake, Nosko and Tadelis (nber.org)
- 2020 IPO filing (sec.gov)
- meta-analysis of Search Ads Pause studies (research.google)
- Lewis and Rao (doi.org)
See your real numbers
Import 30 days of orders or leads during a 5-minute onboarding. Works for e-commerce and service businesses.
See plans and pricing