
Measure Marketing Performance With Three Numbers You Own
Measure marketing performance with three numbers from your own orders: profit on ad spend, cost of a new customer and assisted profit. Agency or in-house.

Tilen Ledic
Written by
The monthly report arrives: click-through rates up, impressions up, "strong ROAS on the winter campaigns". Everything sounds good, and yet the question the owner actually has, is this marketing making us money, stays unanswered. Not because anyone is hiding anything; the standard reports simply are not built to answer it.
To measure marketing performance, whether you run ads yourself or a good agency runs them for you, three numbers are enough, and all three come from your own orders rather than from an ad platform: the profit your ad spend produces, what a new customer costs and brings, and the profit of the sales your campaigns helped along the way. This guide explains each one in plain language, shows why an approximate margin is enough to start, and how to review the three together every month.
Why ad platform reports cannot answer how marketing is doing
Because every platform grades its own homework, in revenue rather than profit. Google Ads reports the conversions Google touched, Meta reports the ones Meta touched, and the same order routinely appears in both. Clicks, impressions and CTR describe activity, not outcome; they can all rise in a month where the business earned less. And ROAS, the most trusted number of the set, compares revenue to ad spend while knowing nothing about what the products cost you.
None of this means the reports are dishonest. It means they measure motion. To judge marketing you need numbers that measure money, and money lives in your orders: what was sold, what it cost, who bought it, and whether they were new. That is also why those numbers work equally well for judging your own campaigns and an agency's: they come from a source nobody in the reporting chain can adjust.
How to measure marketing performance without an analyst
Measure marketing performance with three questions a non-marketer can ask and a single screen can answer: does the ad spend produce profit, do we win new customers at a price that makes sense, and do our campaigns help sales they do not get credit for. Each question has one number, each number is explainable in a sentence, and each is worth comparing month over month rather than reading once.
The bar for precision is lower than most owners fear. You do not need perfect bookkeeping inside your analytics; you need numbers directionally right and consistently computed, so the trend is real. Exactness can come later. What matters is that the three numbers exist at all, because without them every budget conversation falls back to the platform screenshots.
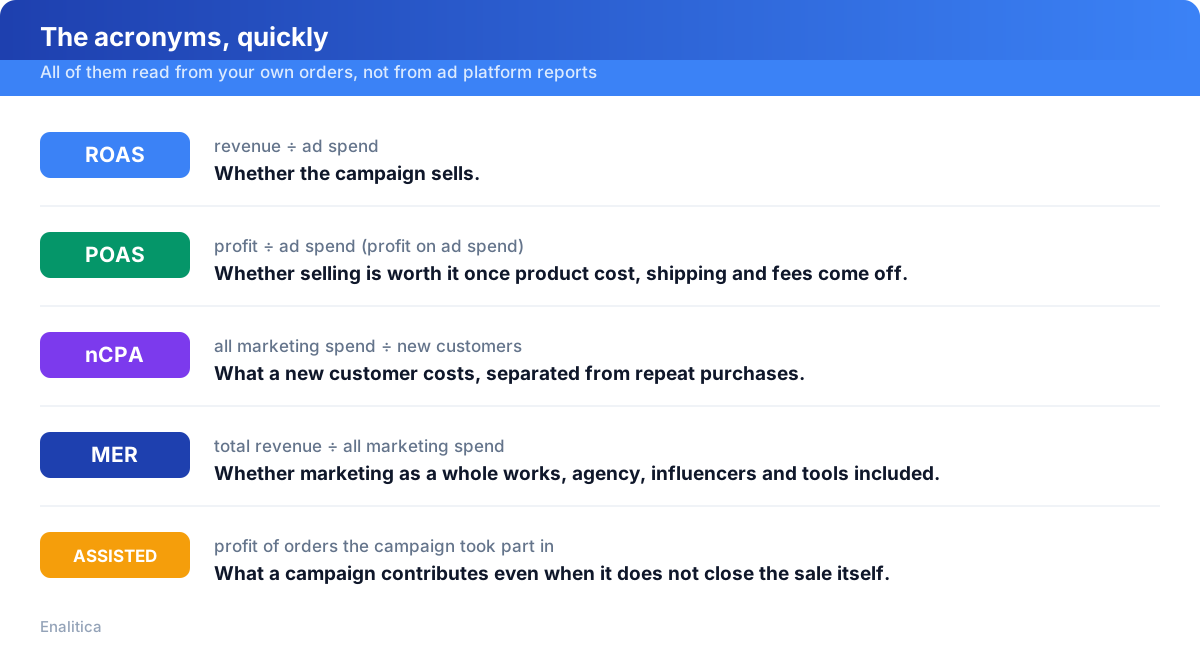
Since the same acronyms keep showing up in reports, here they are in plain language. ROAS is revenue per euro of ad spend. POAS (profit on ad spend) is profit per euro of the same spend, so what is left after product cost, shipping, fees and returns. nCPA is the cost of a new customer: all marketing spend divided by the number of first-time buyers. MER looks wider still and divides total revenue by all marketing spend, agency, influencers and tools included. None of them is a secret, and all of them read from your own orders.
Number 1: profit on ad spend, even with an approximate margin
Most store owners know their ROAS; far fewer know their POAS, profit on ad spend. The calculation is the same as ROAS, except the numerator is profit rather than revenue. The difference is everything the business pays for that platforms ignore: product costs, shipping, payment fees, returns. A campaign with ROAS 4.0 looks excellent, but at a 25% product margin the same campaign is at break-even. Every euro of budget it gets is buying revenue, not profit.
The usual objection is "we do not track purchase prices in our analytics". You do not have to, at least not to start. If you know your average margin even approximately, plug that in: POAS computed from an average margin is not accounting-grade, but it instantly separates campaigns that earn from campaigns that only sell, and the month-over-month trend is trustworthy because the assumption is constant. Stores that later import exact purchase prices mostly confirm what the approximation already showed, with sharper edges.
One habit to pair with it: read profit next to ROAS, never instead of it. ROAS tells you the campaign sells; profit on ad spend tells you whether selling is worth it. Both belong in the same table, at equal weight.
What does a new customer cost, and does the number improve?
The second number splits your revenue into two kinds: money from new customers and money from returning ones. Both are good news, but they mean different things. Returning revenue is the fruit of past work; new-customer revenue is what your current campaigns are actually hired to produce. A healthy total can quietly hide the fact that hardly any new customers are arriving and the existing base is carrying the month.
Two figures make this visible. The cost of a new customer, usually written nCPA: all marketing spend divided by the number of first-time buyers that month. The word "all" carries weight, because the denominator is not only ads but the agency, influencers and tools as well; leave those out and a new customer looks cheaper than they are. The second figure is the share of revenue that came from those first-time buyers. Watch both across a few months and the story tells itself: acquisition getting cheaper or dearer, new blood growing or drying up. Add what those customers are worth over the following months and you know whether an "expensive" customer is actually expensive, or pays for themselves by their third order.
This is also the fairest possible ground for a conversation about marketing: not "is the ROAS good", but "are we winning customers at a price the business can afford, and is that improving".
Number 3: assisted profit before any campaign is paused
Campaigns play positions. Some close sales and collect the credit; others open the journeys that closers finish, and on a last-click report the openers always look worst. Judging a month's work without seeing assists rewards whoever happens to stand at the end of the journey, which is exactly how budgets drift toward brand search and remarketing until there is nothing left filling the pipeline.
The number to ask for is assisted profit: the profit of all orders a campaign participated in, not just the ones it closed alone, next to its spend. A campaign is a genuine pause candidate only when both readings are below break-even over a real window; the full checklist is in assisted conversions: check them before you pause a campaign. In a monthly review this one number prevents the most expensive kind of tidying up: switching off the campaign that was quietly opening half the month's sales.
How to review the three numbers with your marketing agency
Fifteen minutes a month is enough, and the tone is collaboration, not audit. A capable agency will genuinely welcome this conversation: the same three numbers that show you how marketing is doing also prove their work in the only currency that matters. Marketing that earns money deserves a bigger budget, and now there is a shared way to see it.
A practical rhythm for the review:
- Profit on ad spend, whole account and per campaign. Rising, stable, or bought with margin? Which campaigns carry it?
- New customers: how many, at what cost, trending which way. If revenue holds but new customers fade, the topic is prospecting, not panic.
- Assisted profit on anything about to be cut. Every pause proposal comes with its assist reading attached.
One more principle worth agreeing on early: the numbers live in a tool the business owns and both sides can open. Not because anyone distrusts anyone, but because decisions go faster when everyone reads the same screen, and the history stays with the business through any change of team, agency or platform.
How Enalitica keeps all three numbers on one screen
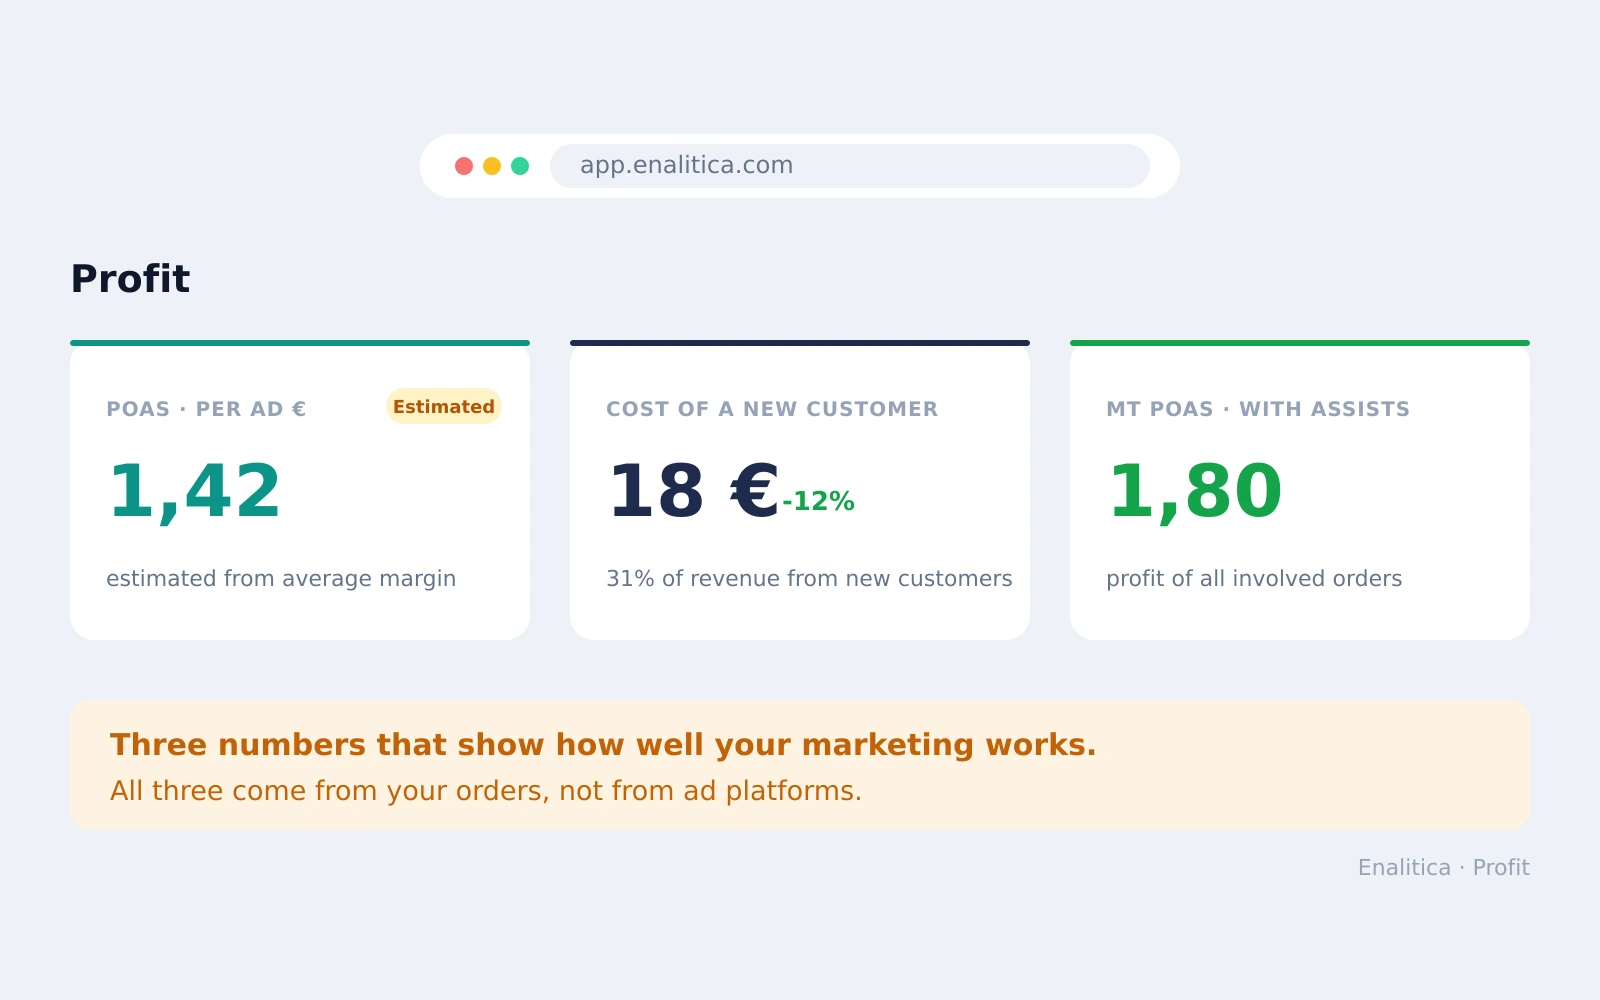
Enalitica computes all three from your orders and keeps them a click apart. The Dobiček view shows profit on ad spend for the whole account and every campaign, with an approximate margin supported from day one and an "estimated" label showing exactly how much rests on the approximation, so nothing pretends to be more precise than it is. The same view carries the new-customer block: what a customer costs, what share of revenue new customers bring, how both moved against last month, and cohort curves showing when a customer pays back.
Every campaign table shows assisted numbers next to direct ones, revenue and profit both, and even the automatic recommendations check assisted profit before ever suggesting a pause. Each metric carries a plain-language explanation of how it is computed, which matters in exactly the meeting this article is about: nobody needs an analyst to referee what a number means.
Book a demo and bring your last monthly report; we will find the three numbers behind it together.
Frequently Asked Questions
Is ROAS enough to judge marketing performance?
ROAS is a good start and everyone understands it, but it compares revenue to ad spend and ignores product costs, fees and returns. Two campaigns with identical ROAS can be a money-maker and a money-loser. Reading profit on ad spend next to ROAS, at equal weight, closes that gap.
What if I do not track product costs anywhere?
Start with your average margin, even a rough one. Profit computed from an approximate margin already separates earning campaigns from merely selling ones, and its month-over-month trend is reliable because the assumption stays constant. Import exact purchase prices later, when the habit is formed.
How do I know if my marketing agency is doing a good job?
Look at the three numbers that come from your orders rather than the platforms: profit on ad spend, the cost and share of new customers, and assisted profit on anything being cut. A good agency will happily review them with you monthly, because the same numbers that inform you also showcase their work.
Who should own the marketing data, the agency or the business?
The business, with the agency working inside it. Ad accounts, analytics and the reporting tool should belong to the company, so history survives any change of partner and both sides always read the same numbers. Good agencies prefer this arrangement too; shared numbers end arguments before they start.
See your real numbers
Import 30 days of orders or leads during a 5-minute onboarding. Works for e-commerce and service businesses.
See plans and pricing