
Conversion Tracking Audit: How Many Orders You Really See
A 30-minute conversion tracking audit: five numbers show how many orders your tracking really sees, where the rest disappear and when accuracy is enough to act.

Tilen Ledic
Written by
A conversion tracking audit is a 30-minute check that uses five numbers to show what share of your orders your tracking actually sees. For most EU ecommerce stores the answer sits between 60 and 80 percent, not 100. That is not a flaw in your setup but the reality of measurement after consent banners, ad blockers and iOS restrictions; why no tool reaches 100 percent is covered in our server-side tracking guide. This article is the practical sequel: instead of trusting promises, you measure your own tracking gap, with data you already have and without a developer.
What a conversion tracking audit measures: five numbers
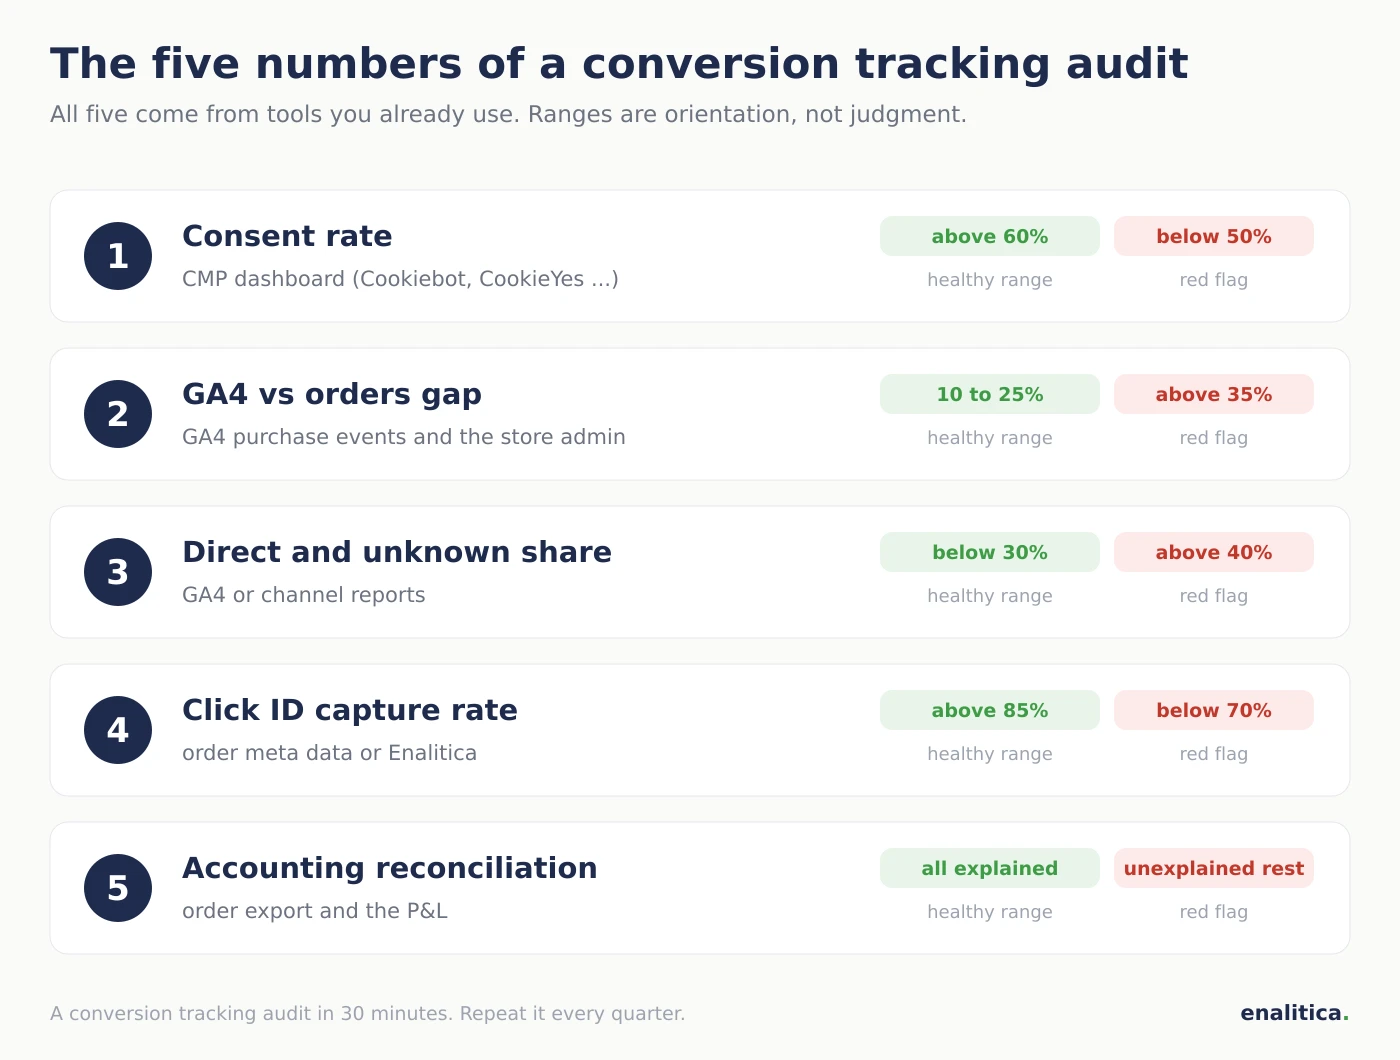
A conversion tracking audit measures five numbers: your consent rate for marketing cookies, the gap between GA4 purchases and real orders, the Direct and unknown share in your reports, the click ID capture rate on paid orders, and the difference between reported revenue and accounting revenue. All five come from tools you already use: your CMP, GA4, the store admin and an order export.
| Number | Where to find it | Healthy range (guide) | Red flag |
|---|---|---|---|
| Consent rate | CMP dashboard (Cookiebot, CookieYes ...) | above 60% in ecommerce | below 50% |
| GA4 vs orders gap | GA4 and store admin | 10 to 25% | above 35% |
| Direct and unknown share | GA4 or channel reports | below 30% | above 40% |
| Click ID capture rate | order meta data or Enalitica | above 85% of paid orders | below 70% |
| Accounting reconciliation | order export and P&L | every difference explained | unexplained remainder |
The ranges are orientation, not judgment: a store with a technical audience will score worse than a fashion store even with an identical, correctly installed setup. The point of the audit is to know your own numbers and watch them over time, not to hit someone else's benchmark.
Why does GA4 show fewer orders than your store?
GA4 shows fewer orders because the purchase event travels from the browser: denied consent, ad blockers and interrupted sessions stop it, while the order still exists in the store. For an average EU store the gap runs 10 to 30 percent. One of our clients with a technical audience loses about 38 percent of orders in GA4, with a completely correct installation.
Business reasons stack on top of the measurement gap and have nothing to do with tracking quality: phone and email orders created directly in the ERP, cancelled and failed orders that the admin counts differently than GA4, and cash on delivery, where the order exists but the payment may never arrive. The full stack of measurement losses, from ad blockers to Safari's cookie limits, is broken down in our multi-touch attribution guide; for the audit it is enough to know the gap is not one hole but the sum of several smaller ones.
Step 1: Your consent rate from the CMP dashboard
The consent rate is the share of visitors who allow marketing cookies in your cookie banner, and it is the first audit number because it caps all the others: a visitor who declines consent cannot be compliantly measured by any tool. You will find it in your CMP dashboard (Cookiebot, CookieYes, Consentmanager and similar all report acceptance by category).
Write down the percentage for marketing or advertising cookies, not the overall one. On strict EU markets with a banner that offers an equally prominent reject button, fewer than half of visitors accept; ecommerce stores usually sit above that, and we broke the numbers down by country in our attribution by country guide. One thing matters when reading vendor pitches: the consent rate is not a technical fault a tool can "fix". A tool that promises measurement without consent is not solving consent, it is bypassing it, and that risk sits with you, not with the vendor.
Step 2: The gap between GA4 purchases and real orders
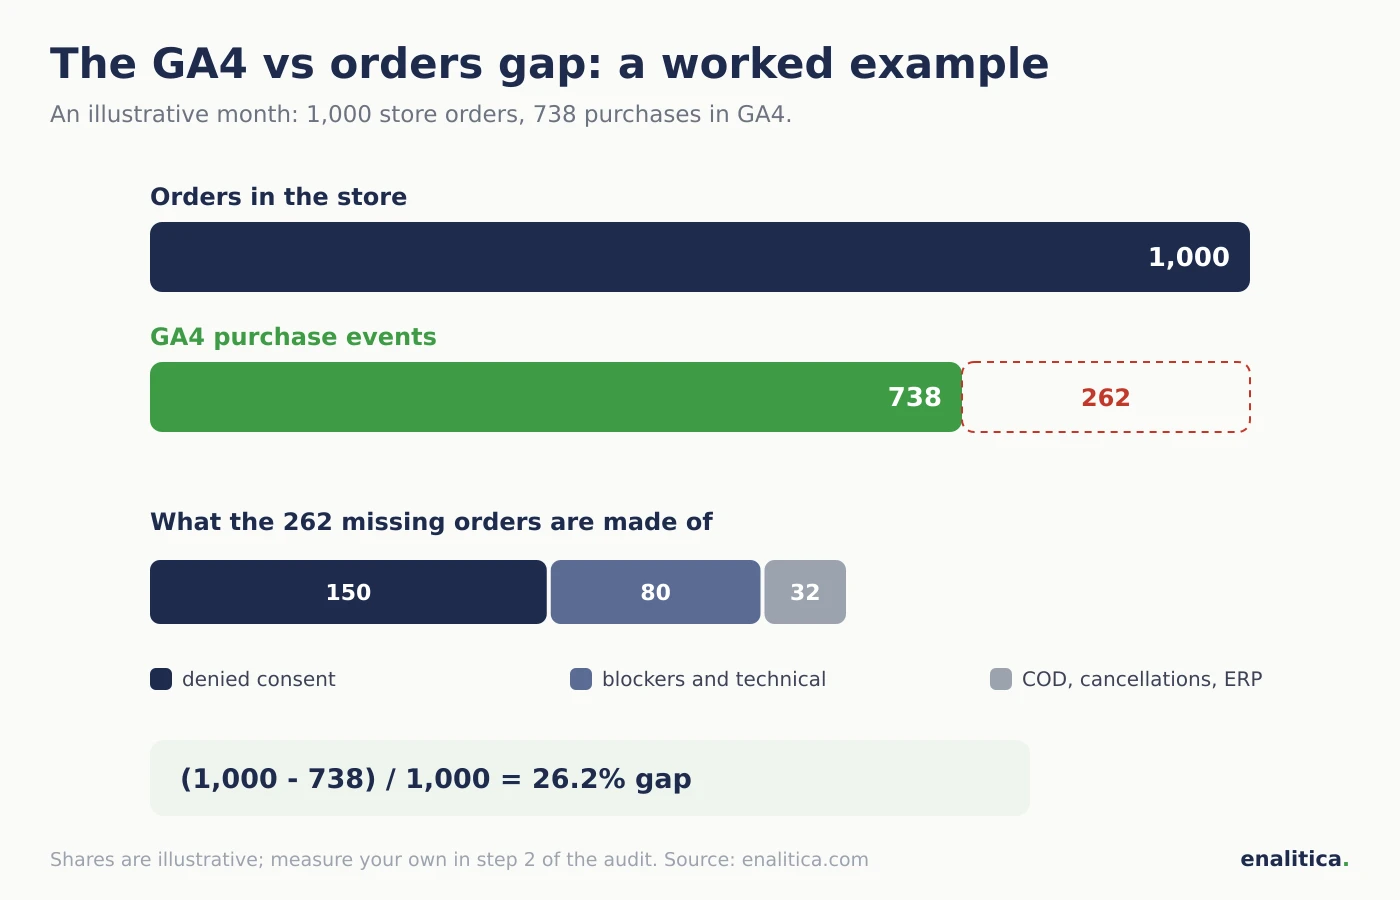
The gap takes five minutes to compute: count purchase events in GA4 for last month, then count orders in the store admin for the same period, excluding cancelled and failed ones. The formula is (orders minus GA4 purchases) divided by orders, times 100. If the store received 1,000 orders and GA4 shows 738 purchases, your tracking gap is 26.2 percent.
Two counting traps. First, GA4 delivers data with a 24 to 48 hour delay, so never compare yesterday; in Enalitica we wait a full four days before marking an order as having no GA4 data. Second, the periods must match exactly, including the account's time zone. A result under 25 percent is normal for an EU store; above 35 percent deserves a look: either your audience carries an unusually high blocker share, or something technical is broken, for example a purchase event that never fires on the thank-you page.
Step 3: Direct and unknown share in your reports
The Direct share is the percentage of orders or revenue with no known source in your reports, and it is the third audit number because a high Direct share usually means broken capture, not mysterious customers typing your URL by hand. Check it in GA4 or in your channel report for last month.
WooCommerce has a known systemic trap here: it resets its own attribution after roughly 30 minutes of inactivity, so a customer who clicks an ad on Monday and buys on Friday is recorded as Direct in the admin. The full mechanism, and the fix with first-party cookies that keep the click ID for 90 days, is described in why WooCommerce orders say Direct. One more detail when reading this number: an honest report separates Direct from Unknown. In Enalitica, orders with no signal under denied consent are classified as Unknown and never added to Direct, because otherwise Direct would look like a growing channel when the only thing growing is the hole in measurement.
Step 4: Click ID capture rate on paid orders
The click ID capture rate tells you what share of orders from paid channels carries a click identifier: gclid for Google Ads, fbclid for Meta, li_fat_id for LinkedIn. A click ID stored on the order is the hardest evidence an ad participated in the sale, which makes this number the core of any order-based attribution.
Measure it by counting last month's orders attributed to paid channels and checking how many carry a stored click ID (in WooCommerce in the order meta, in Enalitica on the order card). Our tracking script captures eight different click IDs and keeps them in first-party cookies for 90 days, and the cross-device gap only closes when a customer types an email address, so be realistic: capture will never reach 100 percent. In our data, above 85 percent of paid orders is achievable; below 70 percent usually means cookies are not surviving the path to checkout. One more honest number from practice: when we send verified purchases back to Google Ads server-side, 60 to 70 percent of gclid orders import successfully, because Google rejects clicks that are too old and clicks from free listings. Even the best pipeline has measurable limits, and a vendor should say them out loud.
Step 5: Reconciling reported revenue with your accounting
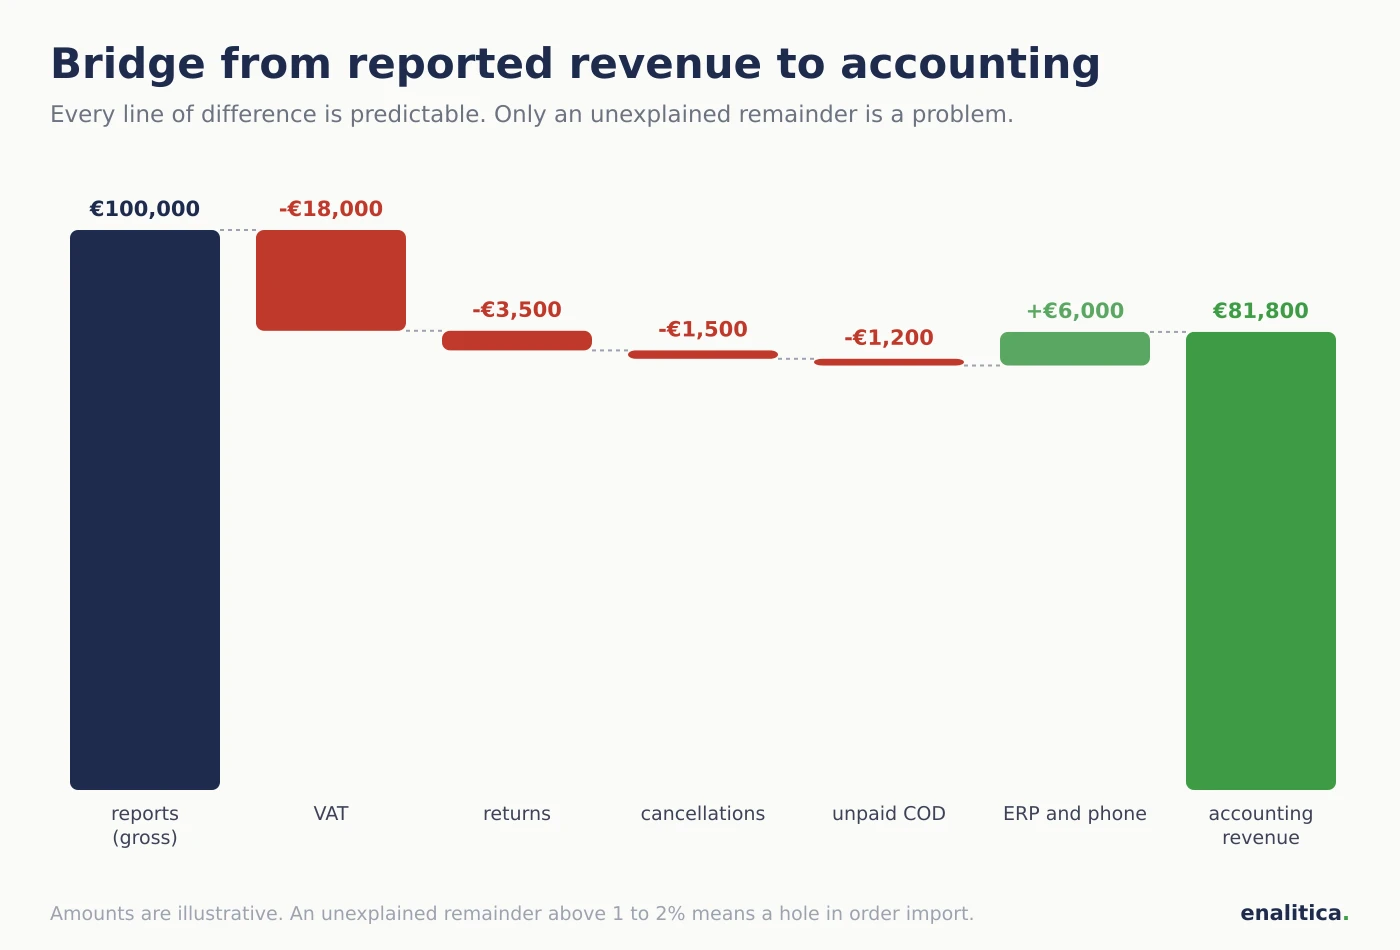
Revenue reconciliation is the last and strictest audit number: put the revenue from your advertising reports next to the accounting revenue for the same month and explain every difference. Reports and the P&L almost never match to the cent, and that is fine; the problem is a difference you cannot explain.
The legitimate reasons differ in predictable ways and can be listed up front:
| Reason | Direction of difference | Explainable? |
|---|---|---|
| VAT: reports gross, books net | reports higher | ✓ |
| Returns and partial refunds | reports higher | ✓ |
| Cancelled and failed orders | reports higher, if not excluded | ✓ |
| Unpaid cash on delivery | reports higher | ✓ |
| Phone and ERP orders | books higher | ✓ |
| Order date vs invoice date | either, at month end | ✓ |
| Unexplained remainder | any | ✗ |
The procedure: take total revenue from your channel report, subtract VAT, subtract returns and cancelled orders, add orders placed outside the website, and see what remains. In Enalitica the first two lines are already handled, because every refund amount is written onto its order and cancelled orders are excluded from all reports; returns are even sent back to Google Ads server-side as conversion adjustments, so the platform optimizes on the net truth too, which we covered in POAS vs ROAS when returns hit. If after all the lines an unexplained remainder above a percent or two survives, you have a hole in order import, not in marketing.
How much tracking accuracy is enough for ad decisions?
Ad decisions do not require perfect attribution; they require a number solid enough for the specific decision in front of you. Different decisions tolerate different uncertainty, so the question is always "accurate enough for what", never "what percentage". The same numbers also feed Google's automation: Smart Bidding and AI Max search term expansion learn only from the conversions your tracking sees, so an unaudited setup misleads the machines, not just the reports.
| Decision | What you need | Why it is enough |
|---|---|---|
| Monthly direction: profitable or not | MER, total revenue against total spend | needs no channel attribution at all |
| Shifting budget between channels | comparably measured revenue per channel | the error sits on both sides alike |
| Scaling a campaign | a reliable lower bound on its return | if even the lower bound earns, it truly earns |
| Killing a campaign | a lower and an upper bound | switching off an assist is expensive |
In practice this means a range instead of a single number. In Enalitica every campaign shows a direct POAS, profit counted only from orders where the campaign was the sole channel (the lower bound, with no double counting), and a multi-touch POAS, counting every order the campaign participated in (the upper bound). A campaign is safe to switch off only when the multi-touch POAS is also below 1.0; what belongs inside that calculation is explained in how well is your marketing really working. And MER stays the guardrail above everything: when the whole business earns, you can debate the details calmly.
Six questions to ask a tracking tool vendor
Ask a conversion tracking vendor six questions during the demo and listen for whether the answers come as numbers or as adjectives. A good tool answers all six calmly, because limits are part of an honest offer.
- What exactly does your accuracy percentage measure? Matching events to a server is not the same as attributing orders to campaigns correctly; the difference is explained in our server-side tracking guide.
- What happens to a visitor who declines consent? The only compliant answer is that they are not measured; anything else is risk sitting on your side.
- Do your channels sum to the store's total revenue? If the channels add up to more than you sold, the tool double counts.
- How do you count returns, partial refunds and cancellations? Revenue without returns is inflated by exactly your returns share.
- Do you count view-through conversions? A view without a click can inflate ROAS by a multiple, so it must be separated and labeled.
- Can I verify the numbers on my own orders before buying? A trial on your own data is the only test that counts.
If your store runs on WooCommerce, the fixes for every gap this audit surfaces are collected in one place, the complete WooCommerce conversion tracking guide.
How Enalitica measures your tracking gap on real orders
Enalitica performs the audit from this article for you, because it is built on orders rather than pixel events. Orders import directly from the store, so they exist in the report regardless of consent and blockers; every order lands in exactly one channel and the channel sum always reconciles to total revenue. Whatever carries no signal is labeled Unknown, not Direct and not "modeled".
Your tracking gap becomes visible on one screen: the ROAS truth header puts side by side the number the platforms claim, last click and first click from your own orders, and the MER of the whole business. The difference between the first card and the other three is precisely the inflation this article is about, measured on your data. Click ID capture, the Unknown share and returns are visible per order, so you check all five audit numbers without a spreadsheet. Your last 30 days of orders import on day one, which means you can run the audit on real data in a single morning: see plans and pricing or book a live demo and we will read the numbers together.
30-minute tracking gap audit checklist
- Read the marketing-cookie consent rate off your CMP dashboard (5 minutes).
- Count GA4 purchase events and real orders for the same past month, cancellations excluded (10 minutes).
- Compute the gap: (orders minus GA4 purchases) / orders (1 minute).
- Read the Direct and Unknown share in your channel reports (5 minutes).
- On a sample of 20 paid orders, check how many carry a click ID (5 minutes).
- Reconcile reported revenue with accounting: VAT, returns, cancellations, cash on delivery, ERP orders (5 minutes).
- Write all five numbers down with a date and repeat the audit every quarter.
- Investigate unexplained differences before changing tools or agencies: most "missing orders" turn out to be one of the lines from step 6.
Frequently Asked Questions
How big a conversion tracking gap is normal?
For an EU store a gap of 10 to 30 percent between GA4 and real orders is normal, driven mostly by the consent rate and the share of technical visitors running ad blockers. Values above 35 percent deserve a technical review of the installation; values below 10 percent are rare and usually mean an unusually permissive audience.
Can I reach a 100 percent match between GA4 and orders?
No, and be careful with any tool that promises it. GA4 measures events from the browser while orders are created in the store; consent, ad blockers and interrupted sessions always stand between the two. The realistic goal is to know, explain and monitor your gap; a perfect match only exists when you count the orders themselves, which is what order-based attribution does.
Why does Meta Ads Manager report more purchases than my store has?
Meta includes view-through conversions, views without a click, and conversions estimated through modeling, so Ads Manager regularly shows more purchases than the store ever received. How the platforms differ in their counting rules is broken down in how Meta, Google and Enalitica count conversions.
How often should I repeat a tracking audit?
Repeat the tracking audit every quarter and after every major change: a theme or checkout switch, a new cookie banner, a new advertising channel or a store redesign. Write the numbers down with dates, because the trend matters more than any single reading; a ten-point drop after a theme change tells you more than any benchmark.
Do I need a developer to run a tracking audit?
No. All five numbers come from tools with a user interface: the CMP dashboard, GA4, the store admin and an accounting export. You need a developer only once the audit uncovers a technical fault, for example a purchase event that never fires, and at that point the audit saves them hours of searching because it shows which of the five numbers is off.
See your real numbers
Import 30 days of orders or leads during a 5-minute onboarding. Works for e-commerce and service businesses.
See plans and pricing