
Modeled Conversions vs Real Orders: See Both Sides
Modeled conversions are estimates platforms blend into reports. Why Meta and your store disagree, why both numbers matter, how to read them side by side.

Tilen Ledic
Written by
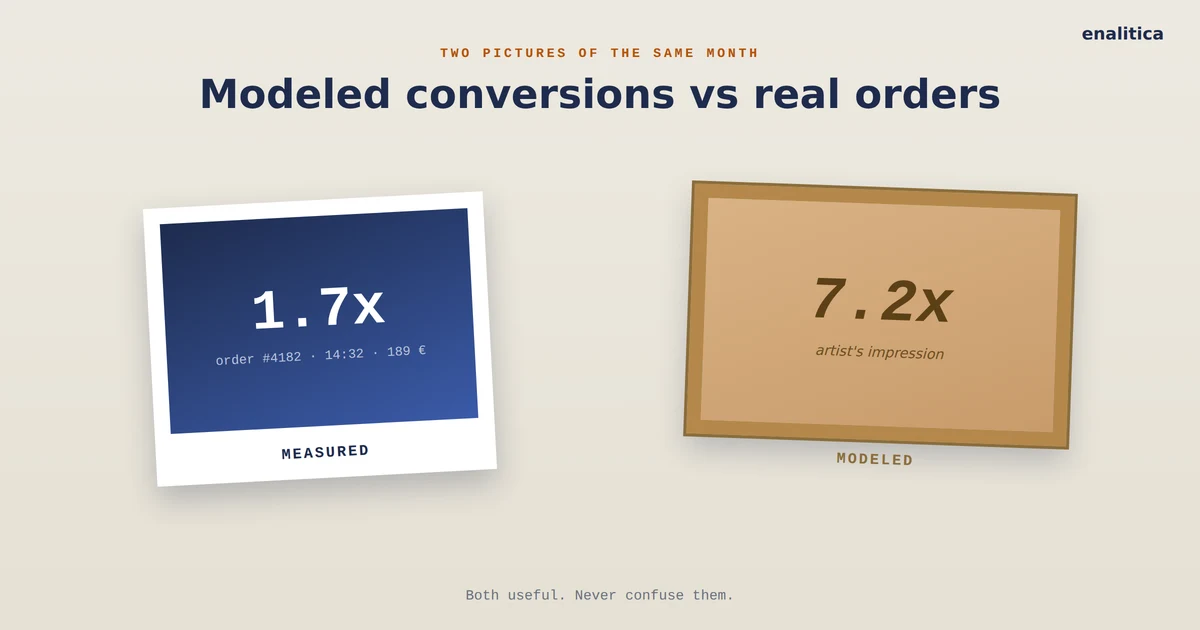
Open Meta Ads Manager and it says your campaigns brought 7.2x return. Open your store's order list for the same month and the math says 1.7x, maybe 3.6x if you are generous about shared credit. Neither screen is lying to you, and that is exactly what makes the situation so confusing: one of them is counting modeled conversions, estimates of what probably happened, while the other is counting orders that actually landed in your database.
Most guides pick a side at this point. This one will not, because as a store owner you genuinely need both numbers, the way a pilot needs both the weather forecast and the view out of the window. What you cannot afford is to mix them up without knowing which is which.
This post explains where modeled numbers come from in plain language, why the two screens drift apart so quickly, and how seeing them side by side turns a confusing argument into a strategic decision that stays yours.
What Modeled Conversions Are in Plain Language
Modeled conversions are sales a platform did not actually observe but estimated, using the behavior of the customers it could see as a template for the ones it could not. When a visitor declines cookies, GA4 estimates what people like them probably did and, in Google's own words, "seamlessly integrates" that estimate with the observed data in the same reports. A data-quality icon tells you the report contains estimates; no row tells you which ones.
Platforms did not invent this out of malice. Consent banners, iOS privacy screens and ad blockers punched real holes in their view, and modeling is their way of patching the holes so campaigns can still be optimized. Google's own figure, published in April 2021, is that consent mode modeling recovers more than 70% of the ad-click-to-conversion journeys lost to consent choices; that is a coverage number, not an accuracy number, and Google adds that results vary widely per advertiser. In Google Ads the Conversions column reports modeled and observed conversions together, and GA4's behavioral modeling has no published accuracy figure at all.
A modeled conversion is a well-educated guess wearing the same suit as a measurement. The report never tells you which one just shook your hand.
Your store's order list is the opposite kind of number. An order either exists or it does not, it has a timestamp, an amount and an invoice, and nobody estimated it into being.
Why Do Meta and My Store Show Different Numbers?
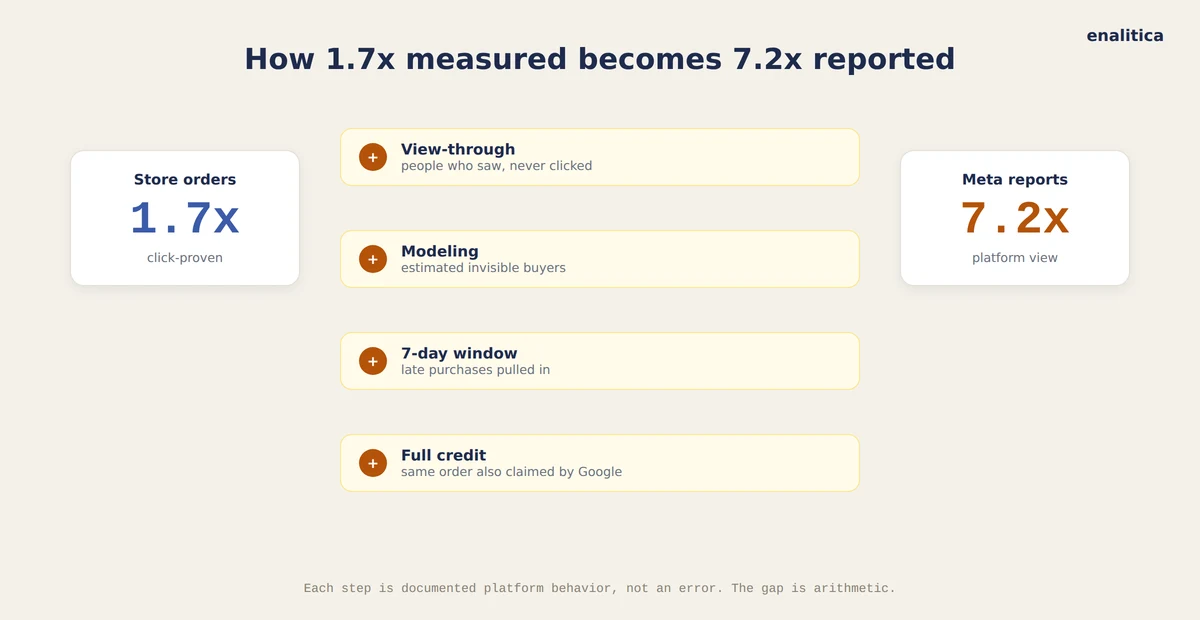
Meta, Google and your store disagree because they answer different questions with different rules, and the gap between them opens fast. Four mechanisms do most of the work:
- View-through credit. Meta counts people who merely saw an ad and bought later, sometimes within a day, without ever clicking. On some campaigns that is close to half of the reported result.
- Modeling. The platform adds estimated conversions for the visitors it lost to consent screens and iOS, which your store never adds, because the store only ships real parcels.
- Attribution windows. A purchase seven days after a click still counts for Meta this week; your store books it on the day it happened.
- Double counting. Meta and Google each claim the same order in full, so their reports together can exceed your actual revenue.
The fourth mechanism is not a rounding error. Count the orders in Enalitica's data that carried a Meta click ID, then count the conversions Meta reported for the same stores, and the second number is 4.6 times the first (stores with both Meta and Google Ads connected, more than 10,000 orders, over €700,000 in revenue, last 90 days to 28 September 2026).
In Enalitica's data, Meta and Google Ads together reported as many conversions as the stores had orders in total, including every order from email, organic search and direct visits.
Add these up and a 7.2x platform ROAS sitting next to a 1.7x click-proven ROAS is exactly what the arithmetic produces. The problem starts only when someone treats one of the numbers as the whole truth.
Even Tools That Promise Exact Numbers Often Model
Few vendors say this out loud: most attribution tools that promise to "recover" your lost data are modeling too, they just do it with nicer words. Northbeam openly sells modeled multi-touch plus media mix modeling, Polar Analytics documents a fingerprinting fallback for blocked cookies, and Tracify advertises "consent-independent" tracking, which should raise an eyebrow rather than a budget. We compared them line by line in our honest guide to attribution software, and when TrueROAS pointed the same triangulated pitch at us directly, we fact-checked it claim by claim in TrueROAS vs Enalitica.
The test that cuts through every sales deck is one question: can you click the number and see the actual orders behind it? If yes, it is a measurement you can audit. If no, it is a model, however confident the dashboard looks, and a model's filled-in part cannot be verified by anyone, including the vendor.
Ask one question about any conversion number: can I click it and see the orders? Everything else is branding.
None of this makes models useless. It makes them a different instrument, and different instruments belong on different parts of the dashboard.
Why Seeing Both Numbers Beats Picking a Side
Both numbers earn their place because they are good at different jobs. The platform's modeled figure is what its bidding algorithm actually optimizes against, so it tells you how Meta or Google perceives your campaign, and feeding the platforms good signals keeps that perception sharp. The order-based figure tells you what the bank account saw, which is the number you can defend at the end of the month.
This is why Enalitica shows them side by side instead of hiding one. In the campaign table below, every row carries the click-proven ROAS in blue, the multi-touch ROAS in green where shared credit is acknowledged, and the platform's own reported ROAS in amber, together with the share of the platform's claim that came without any click. The numbers are demo data, the layout is the real report.
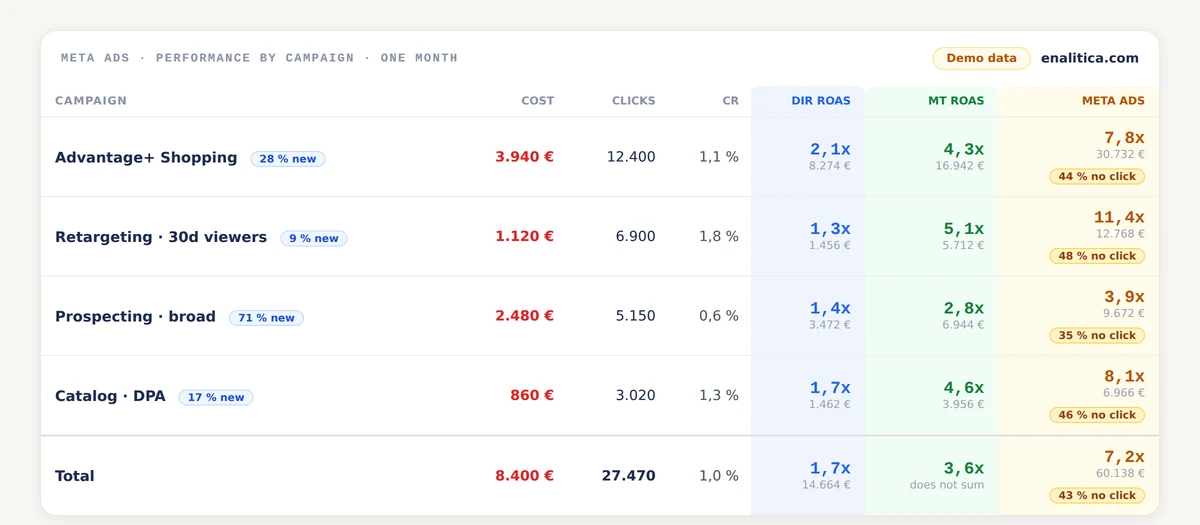
Read one row and the whole story is there: Meta says 11.4x on retargeting, the orders say 1.3x directly and 5.1x with shared credit, and 48% of Meta's claim never involved a click. Whether that campaign deserves more budget stops being a matter of faith and becomes a judgment call you can actually make, because the decision stays with you, not with whichever dashboard shouts the loudest.
One thing we keep seeing across our clients deserves saying here, because last-click numbers put Meta in a harsher light than it earns: when a store invests seriously in Meta, its organic and direct traffic rise with it, brand searches multiply, and orders arrive days later through channels Meta never gets credit for. We can see the lift; we cannot measure how much of it is Meta's, and neither can anyone honestly. Read the Meta row as a floor, not a verdict; the Meta halo guide explains what we see and why nobody can size it.
How to Read Modeled and Measured Numbers Together
A practical routine for using both sides without a data science degree fits in three habits. Use the order-based numbers when moving budget between channels, because that comparison needs one honest yardstick and the store's revenue is the only figure all channels share. Let the platforms keep their modeled view for optimizing within their own walls, where their algorithms genuinely use it. And watch the gap itself: a platform number sitting a bit above the order truth is normal physics, while a gap that suddenly widens, especially with a high no-click share, is the report asking you to look closer.
The same logic applies to GA4. Its consent-mode modeling only activates on properties that pass Google's thresholds, at least 1,000 events a day from declined visitors for seven days and at least 1,000 consented daily users on seven of the previous 28 days, so many smaller stores never get the estimated fill at all and quietly live with the gap instead. That gap is not small. In the median store in Enalitica's data, GA4 recorded a purchase for only 68.5% of real orders over the last 90 days to 28 September 2026; the spread ran from 95% at the best store down to 47% at the weakest, and the pooled figure was 76.6%. Knowing which situation you are in is half the diagnosis, and our privacy-safe attribution guide covers what can still be measured honestly around it.
In the end it really is the owner's call. Some owners steer by the platform view and accept the estimates, others trust only the order list, and most land where we do: both screens open, each doing the job it is actually good at.
Frequently Asked Questions
Are modeled conversions accurate?
Google has never published an accuracy figure. Its 2021 number, more than 70% of lost ad-click-to-conversion journeys recovered, describes how much of the hole modeling fills, not how often the fill is right, and GA4's behavioral modeling has no published figure at all. In practice accuracy varies by store size and traffic mix, and since the modeled share is not labeled in your reports, you cannot check it yourself, which is the real limitation.
Should I turn off modeled conversions?
Usually not. Platform bidding algorithms optimize against their own numbers, modeled parts included, so starving them of signals tends to hurt delivery. The better move is to keep feeding the platforms while making budget decisions between channels on order-based numbers you can audit.
Why is Meta's ROAS so much higher than my store's numbers?
Because Meta adds view-through conversions, modeled conversions and a seven-day click window on top of what your store books as orders, and it claims full credit even when Google claims the same purchase. A higher platform figure is expected; the useful signal is how large the gap is and how much of Meta's claim came without any click.
Does Enalitica model any of its numbers?
No. Every attributed order in Enalitica carries evidence that arrived with the purchase: a click ID, UTM parameters, a referrer or a witnessed clean visit, and orders without evidence sit in an honest Unknown row instead of being estimated into channels. The platforms' own modeled figures are shown alongside, clearly labeled, so you can compare both worlds in one table.
How much can you trust modeled conversions from ad platforms?
Enough to steer bidding inside one platform, not enough to move budget between platforms. Modeled conversions are consistent with the platform's own history, so a week-over-week change in a Meta or Google Ads report is usually a real change in direction. What the number cannot do is tell you how large the real total is, because the modeled share is unlabeled and each platform models independently; Meta and Google can both be right about their trend and still add up to more purchases than your store had. Trust the direction, verify the level against your orders, and that is exactly the two-column view Enalitica keeps side by side.
Sources
The outside pages this article relies on. Links checked on 3 October 2026.
- GA4 estimates what people like them probably did (support.google.com)
- April 2021 (blog.google)
- Conversions column reports modeled and observed conversions together (support.google.com)
Figures marked "in Enalitica's data" are aggregates from the real orders of the stores we measure, with no names and no individual orders. How we measure.
See your real numbers
Import 30 days of orders or leads during a 5-minute onboarding. Works for e-commerce and service businesses.
See plans and pricing