
Ecommerce Product Attribution: Which Channel Sells Which Product
Ecommerce product attribution answers which channel sells which product, at what margin. Why campaign ROAS hides it, how to read the product mix, and honest recommendation revenue.

Tilen Ledic
Written by
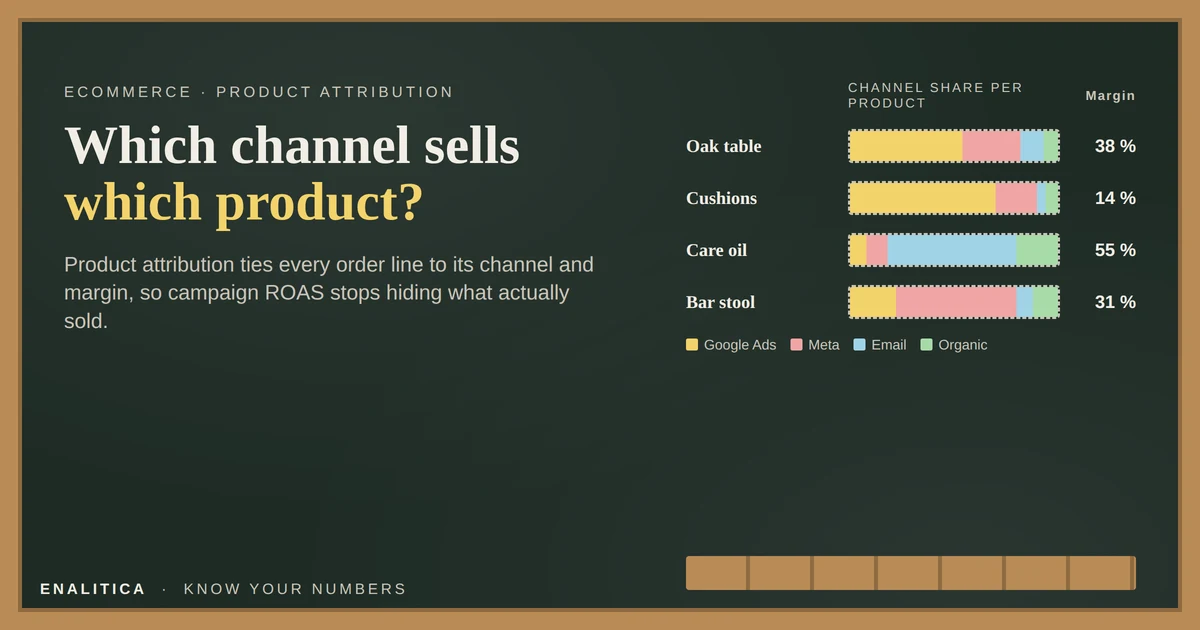
Your campaign report says Google Ads returned 4.1 and Meta 2.6, and the budget meeting ends there. Nobody asks what the two channels actually sold, because the report cannot say: attribution stops at the order, and the order is a bag of products with very different margins, return rates and reasons to buy. A bestseller on one channel can be a loss-maker on the other.
Ecommerce product attribution closes that gap. It ties every order line, not only the order, to the channel that brought the buyer, and reads the result in both directions: which products a channel sells, and which channels sell a product. This guide explains why campaign-level ROAS hides the product behind the sale, how to read the product mix without double counting, what "recommendation revenue" claims are worth, and how to get to margin per product and channel from the data your store already has.
What Is Ecommerce Product Attribution?
Ecommerce product attribution is the practice of assigning each sold product line, rather than each order, to the marketing channel or campaign that led to the purchase, so that product performance and channel performance can be read together. The order carries the click evidence (a click ID, UTM tags, a referrer), the order lines carry the products and their purchase prices, and joining the two produces a product by channel table.
Two readings exist, and a good report shows both. The primary reading gives every order to one channel, the last click before purchase, so product revenue per channel sums exactly to the month. The involved reading counts every channel proven anywhere on the journey, so a product can appear under Google Ads and email for the same order; that is the multi-touch view, and its rows overlap by design. Our multi-touch attribution guide explains why both are needed.
A campaign report tells you which channel closed the order. Product attribution tells you what it sold, and whether that product made any money.
Why Campaign ROAS Hides the Product Behind the Sale
Campaign ROAS averages every product a campaign ever sold into one number, so a 4.1 can be a 7.0 on your hero product and a 1.4 on the accessories the same ads drag along. Budget decisions made on the average then scale the wrong half. Three things disappear inside the average.
- Margin. A campaign selling 40 percent margin products at ROAS 3 earns more than one selling 15 percent margin products at ROAS 5. ROAS ranks them backwards; our POAS guide shows the arithmetic.
- Returns. Fashion sizes and fragile goods come back at multiples of the store average, and a returned order line is not a sale. The POAS versus ROAS with returns post shows two campaigns with equal ROAS and opposite decisions.
- Reason to buy. Search sells what people already look for, social sells what they did not know existed. A product that needs discovery will never show a good search ROAS, and a product with 10,000 monthly searches does not need Meta to be found.
Google Shopping and Performance Max make this worse rather than better, because they optimize on the account's conversion value and quietly pour spend into the products that already sell, which our Performance Max post covers. Only a product by channel view shows whether the winners are the campaign's doing or the product's.
Which Channel Sells Which Product? Reading the Product Mix
To read which channel sells which product, put products in rows and channels in columns, fill every cell with order-line revenue under the primary reading, and look at each row as a share. A product whose row is 80 percent Google Ads lives on intent; a product whose row is 60 percent Meta and 25 percent email lives on discovery and repeat buyers. The share, not the absolute revenue, is the insight.
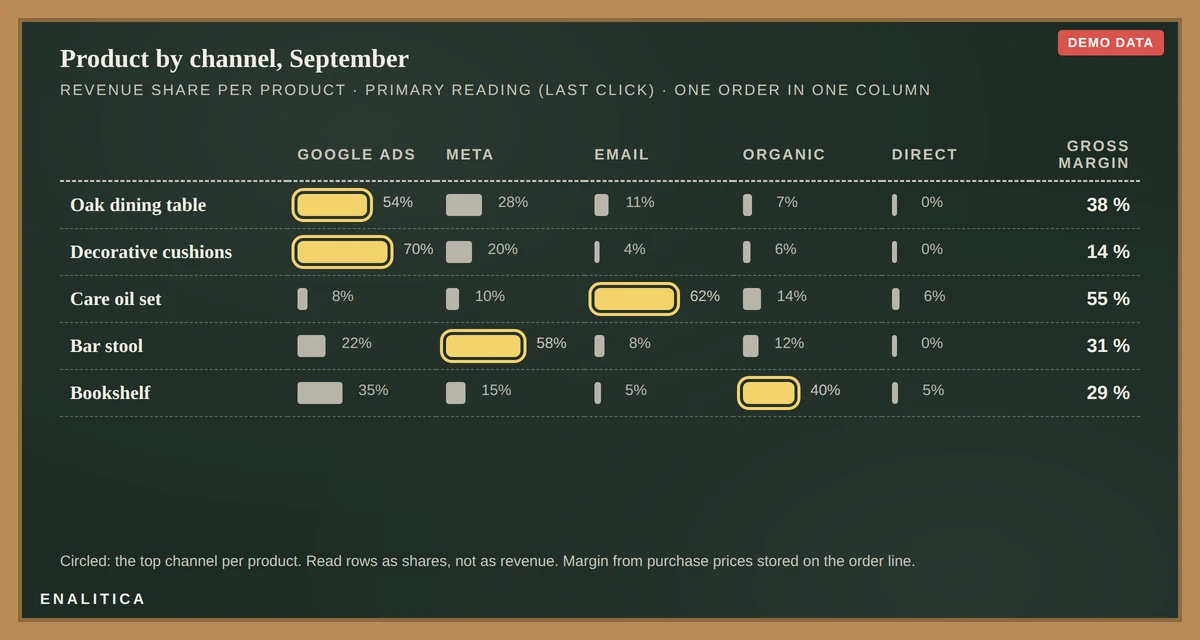
Three patterns come up in almost every store we connect.
- The discovery product. High Meta share, low search share, healthy margin: the product to give Meta budget and to protect from Shopping campaigns that would only cannibalize it.
- The intent product. High organic and Google Ads share, thin margin because everybody sells it: bid on it for the basket it opens, not for its own line.
- The repeat product. High email and direct share, small on every paid channel: the product that pays for acquisition later, which is why customer lifetime value cohorts belong next to this table.
Read the table on order lines, not on first-touch channel alone, and refresh it monthly: a product's channel mix changes when a competitor starts bidding on it or when a creative starts working on Meta.
Product-Channel Fit: Search Sells the Known, Social Sells the New
Search and social sell different products because they meet buyers at different moments, and the product mix per channel makes the difference measurable rather than anecdotal. Google Search converts at roughly 3 to 8 percent because the buyer typed the product; Meta converts at 1 to 3 percent because the buyer was interrupted, but Meta is the only place a product nobody searches for yet can find its first thousand buyers.
The practical rule that follows: match the channel to the product's demand state, not to the account's average ROAS. New and visual products go to Meta first, with the product's channel row watched for the moment search demand appears. Known products with search volume go to Search and Shopping, with brand terms separated so the brand campaign does not flatter the report. Repeat products go to email, where the margin is not eaten by a click.
The table also settles a question every agency debate circles around: whether Meta "creates demand that Google closes". If a product's Meta share is high under the involved reading and low under the primary one, Meta opens the journeys and Google closes them, and pausing Meta will show up as a search decline two months later. The assisted conversions post covers the pause check.
How Do You Measure Recommendation Revenue Honestly?
Recommendation revenue is the revenue a personalization or recommendation widget claims for orders that contain a product it displayed or that a visitor clicked, and it is honest only when the claim is read against the order line and against every other claim on the same order. Vendors in this category report "attributed revenue" by their own rules: a click on a recommended product, a view within a window, sometimes any order after any impression. Nosto's own documentation notes that one order can appear under both its recommendation report and its email report, deduplicated only in the total.
That is the same mechanism as affiliate networks and ad platforms claiming the same order, and the same test applies. Take the widget's monthly revenue figure, list the order lines it counted, and ask three questions: was the product already in the basket or the search intent before the widget showed it, would the order have contained it anyway, and does the ad platform, the email tool or the affiliate network also claim that order. The revenue that survives all three is the widget's; the rest is attribution, not causation.
Which platforms measure recommendation revenue accurately? The ones that show you the order line under the claim and let you see who else claimed it.
Two figures tell you whether the widget earns its fee. The share of orders where the recommended product was a cross-sell nobody searched for (that is incremental basket value), and the widget's claimed revenue as a share of total revenue, which above 20 to 30 percent means it is claiming products people bought anyway. Enalitica does not integrate recommendation widgets, on purpose; what it gives you is the order line with its own channel of origin, which is the reference every widget claim has to be checked against.
Margin per Product: Where ROAS Ranks Products Backwards
Margin per product is what turns product attribution from an interesting table into a budget rule, because a channel's product mix decides its real return. Two campaigns with the same ROAS and different product mixes can differ by half their profit. The inputs are already in the store: the purchase price on every product, copied onto the order line at the time of sale so later price changes do not rewrite history.
| Product | Channel | Revenue | ROAS on its own | Gross margin | Profit on ad spend |
|---|---|---|---|---|---|
| Oak dining table | Google Ads | 12,400 € | 4.1 | 38 % | 1.56 |
| Decorative cushions | Google Ads | 3,900 € | 4.1 | 14 % | 0.57 |
| Oak dining table | Meta Ads | 6,100 € | 2.6 | 38 % | 0.99 |
| Care oil set | 2,200 € | n/a | 55 % | n/a |
Demo numbers, but the shape is universal: the cushions have the campaign's ROAS and lose money; the table on Meta has a worse ROAS than the cushions on Google and earns more per euro. A margin column is the difference between a report and a decision. Where cost prices are missing for part of the catalogue, use the store's average margin for those lines and say so with a coverage share, instead of hiding the profit or quietly averaging over the products that have prices; our cost of goods sold post explains the 15-minute fix for empty cost fields.
Product Attribution Without Cookies: The Order Line Is the Source
Product attribution survives cookie loss better than session analytics because its source is the order line, which exists whether or not any tag fired, and the channel evidence is written onto the order at purchase. GA4 can pair item revenue with the session channel in an exploration, but only for purchases it recorded, under last-click session attribution, without margin and subject to sampling; on EU stores where a large share of visitors declines cookies, its product by channel table is a sample of a sample.
The order-based version reads differently. Every order line is counted, because it comes from the shop's database. The channel comes from the evidence stored with the order: the click ID captured at landing and kept for 90 days, UTM tags, the referrer, a declared source, and, honestly, an Unknown row where no evidence exists. Products sold to Unknown are shown as such instead of being distributed by formula, which is the difference between modeled and measured numbers.
The same table extends to the journey. Because Enalitica stores the journey of every order, any order line can be opened to see the clicks and pages that preceded that purchase, and because it groups customers into cohorts by their first order's channel and first product, the repeat product pattern above becomes visible as cohorts rather than guesswork.
How Enalitica Shows Which Channel Sells Which Product
Enalitica builds the product by channel table from order lines and the click evidence on each order, in both attribution readings, with gross margin from the purchase prices on the lines. It appears in three places, so the question can be asked the way you prefer.
- Monthly AI report. The product and category block ranks the month's products with their channel share, margin where cost prices exist and, for stores that track stock, days of stock left, and the written analysis draws on that table when it explains the month.
- AI dostop (MCP). Ask ChatGPT, Claude, Gemini or Grok directly: "which products did Meta sell in August", "which channels sell the oak table" or "which products earn margin on Google Ads". One query returns the product list with the top channel and channel share per product, the gross profit per product and per channel, and a product filter turns the question around to one product's channel split, including the multi-touch view. Where a product has a purchase price the profit is exact; where it has none, the store's average margin from the profit settings stands in and the row is labelled as an estimate, so a store that only knows its average margin still sees which channel earns on which product. Read-only, no customer data, every call logged, as described in our MCP guide.
- Campaign proposals. Rising categories from the same table feed the Monday campaign opportunities, so a product that starts selling organically is proposed for a search campaign before the competitor notices.
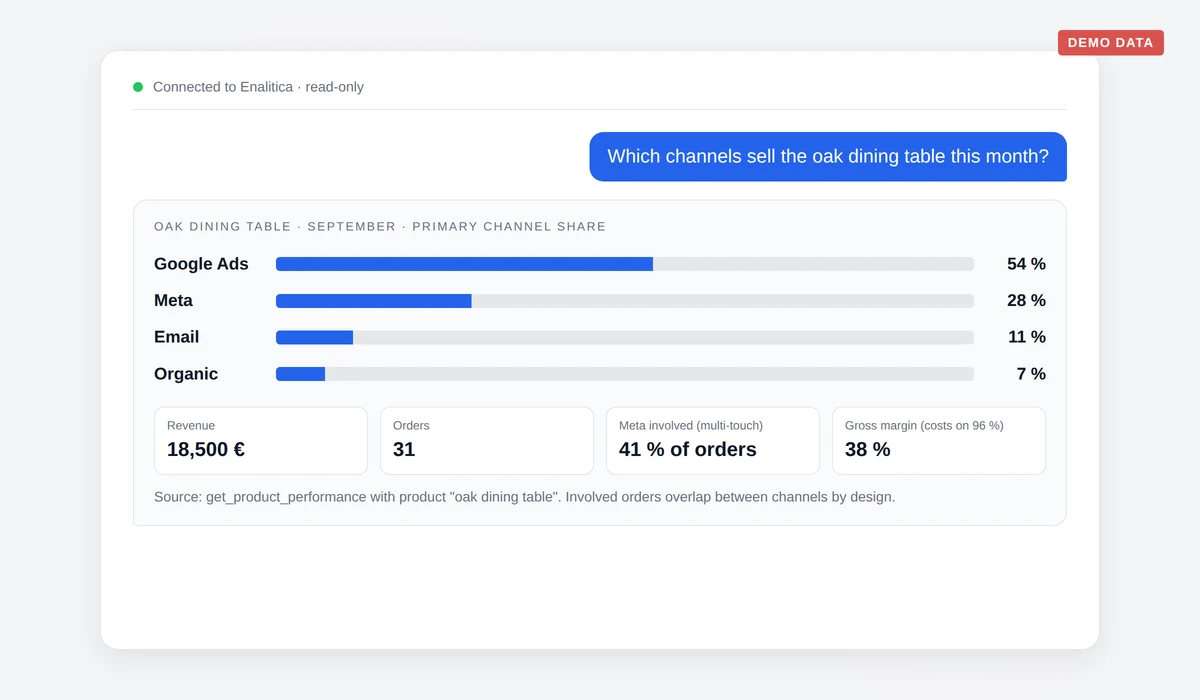
Set-up is the usual: connect the shop, install the tracking snippet so click IDs survive beyond the session, and fill the cost price field. From that point the table fills itself, and the honest parts stay visible: the Unknown row, the cost coverage share and the overlap in the multi-touch reading.
Product by Channel Checklist for Your Store
- Every order line carries the product SKU, quantity, line total and the purchase price at the time of sale.
- Every order carries its click evidence: click ID, UTM tags, referrer, declared source, or an honest Unknown.
- The product by channel table exists in two readings, primary (sums to the month) and involved (overlaps, shows assists).
- Rows are read as channel shares per product, refreshed monthly, with changes noted.
- Each product has a demand state (discovery, intent, repeat) and a channel plan that follows it.
- Margin per product and channel is on the table, with the cost coverage share where prices are missing.
- Recommendation widget, affiliate and email claims are checked against the order line and against each other.
- Returns per product feed back into the product's margin, not only into the store total.
Frequently Asked Questions
What is product attribution in ecommerce?
Product attribution in ecommerce assigns each sold order line to the channel or campaign behind the purchase, so you can see which products a channel sells and which channels sell a product, ideally with the margin per line. It differs from campaign attribution, which stops at the order total, and from product analytics, which counts views and carts without knowing where the buyer came from.
Which products sell best on Google Ads versus Meta?
Products with existing search demand sell best on Google Ads, because the buyer already knows what they want; new, visual and impulse products sell best on Meta, which can show them to people who were not looking. Your own product by channel table settles it for your catalogue, and the answer changes as demand for a product matures.
Which platforms measure recommendation revenue accurately?
The ones that show the order line under each claim and let you see who else claims the same order. Recommendation widgets report attributed revenue by their own click or view rules, and the same order often appears under several of their reports, so read the figure against the order line, the basket it was in, and the other channels claiming it.
Can GA4 show which channel sold a product?
Partly. A GA4 exploration can combine item revenue with the session channel, but only for purchases GA4 recorded, under last-click session attribution, without margin, and subject to sampling and consent loss. On EU stores the missing share is large, which is why an order-based table gives a fuller picture.
Does product attribution double count revenue?
Not in the primary reading, where every order belongs to exactly one channel and product revenue per channel sums to the month. The involved reading deliberately overlaps, because one order can have several proven touches; it is a view of assists, not a second total, and a good report labels it that way.
Do I need cost prices for product attribution?
Not for the channel mix, which works on revenue alone, but yes for the decision layer. Without purchase prices you can see which channel sells a product, not whether it earns money doing so. Fill the cost field for the products that drive most revenue first and show the coverage share until the rest is done.
See your real numbers
Import 30 days of orders or leads during a 5-minute onboarding. Works for e-commerce and service businesses.
See plans and pricing