
The Meta Ads Halo Effect: Why Organic and Direct Rise With Your Meta Budget
The Meta ads halo effect explained for store owners: why brand searches, organic and direct traffic rise with Meta spend, what the studies measured, why no store can put a number on it, and how to read the Meta row before cutting it.

Tilen Ledic
Written by
The report says Meta returned 2.6 on last click, below break-even, and the agency proposes cutting it. Two months after the cut, brand searches are down, organic orders are down, direct is down, and nobody in the room connects the three lines to the one that was cut. That is the Meta ads halo effect, seen from the wrong end.
We see the other end across our clients so consistently that we now write it into every report where Meta looks weak: when a store invests seriously in Meta, its organic and direct traffic rise with it, searches for the brand multiply, and orders arrive days later through channels Meta never gets credit for. This guide is what we can honestly say about that lift, what the published studies measured, why no store can turn it into a percentage, and how to read the Meta row so you do not cut the channel that was feeding the others.
What is the Meta ads halo effect?
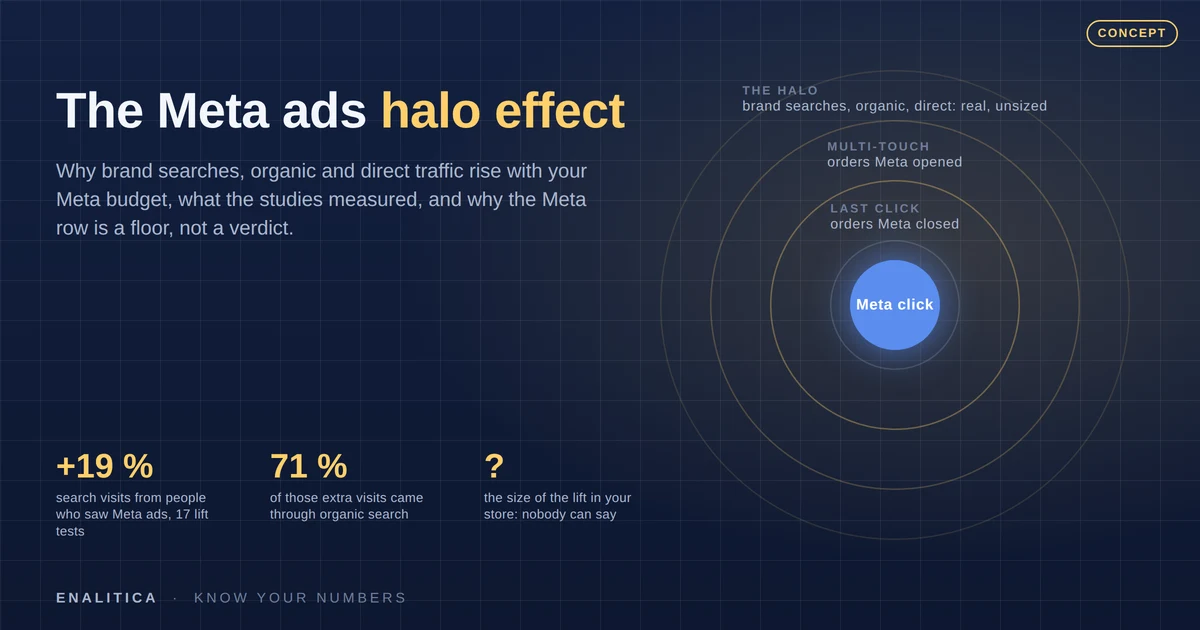
The Meta ads halo effect is the lift Meta advertising produces in channels that never credit it: brand searches on Google, organic and direct visits, and orders that close there days after the ad was seen. It exists because most people who see an Instagram or Facebook ad do not click it, and the ones who click rarely buy in the same session. They come back later by typing the brand name, and the order lands on organic, brand search or direct.
Marketers call the same thing spillover, search lift or cross-channel effect. The mechanism is not specific to Meta; any reach channel produces it, YouTube, TikTok, display, TV. Meta gets the name because it is the reach channel most stores run, and because last-click reporting punishes it hardest.
Meta claims the order it did not close. Last click denies the order it helped start. The truth is between the two, and only the lower end of it can be measured.
Why last-click reporting makes Meta look worse than it is
Three things happen between an Instagram ad and an order, and the reporting sees only one of them.
- The view without a click. A woman sees an oak table on Instagram, does not tap, and searches for the store by name on Thursday. Her order is organic or brand search. Meta counts it as a view-through conversion, which inflates Meta's own ROAS because there is no evidence the view mattered; order-based attribution refuses to count it because there is no click to prove it. Both are consistent. Neither is complete.
- The click that does not buy. She taps the ad, browses, leaves. Four days later she types the store name into Google and buys. With a click ID on the first visit, multi-touch attribution sees Meta at the start and organic at the end, and the order shows up in Meta's assisted column. That part of the halo is measurable, and it is the only part that is.
- The person she tells. Her sister buys the same table a week later, having never seen the ad. That order is direct or organic and no method on earth ties it to Meta.
Order-based attribution puts the first case in Unknown or organic, the second in Meta's assists, the third in Unknown. Meta's dashboard claims the first, counts the second twice, and models the third. This is why Meta and Google report more conversions than you have orders, and why a last-click Meta number is a floor: everything it counts really happened, and some of what it does not count happened too.
What the studies actually measured
The published evidence comes from lift tests, where Meta holds back a random slice of the audience and the advertiser compares the exposed group with the withheld one. Small stores cannot run these, which is why the numbers are worth knowing.
- Brainlabs, 17 Meta lift tests across 12 advertisers: people exposed to Meta ads made 19 percent more search visits to the advertiser's site than the withheld group, and 71 percent of those extra visits came through organic search, 29 percent through paid search. The incremental search visit cost about 6.78 dollars. The write-up is at Brainlabs.
- Nest Commerce, awareness campaigns: a 22.3 percent lift in branded search and 9.4 percent in non-branded search among audiences that saw the ads, reported in their incrementality guide.
- Amsive, a ten-day paid blackout: a healthcare brand paused all paid media for ten days; organic traffic spiked while the ads were dark, dipped slightly when paid returned, but total site volume rose and organic impressions ended 2 percent higher with paid back in market. The case study is one brand, but the direction matches the lift tests: paid and organic move together, not against each other.
- eBay, 2015, the other side of the coin: when eBay switched off its brand search ads, the organic listing below absorbed almost every click. The halo from reach advertising lands on organic and direct, not on paid brand search. If you pay for your own brand name on Google, you may be paying for the halo twice; the brand bidding guide has the numbers.
Read the percentages as evidence that the effect is real and large enough to matter, not as a rate you can apply to your store. A 19 percent search lift for a national fashion brand with a lift test says nothing about the size of the lift for a furniture store in Ljubljana. Which brings us to the honest part.
What we see across our clients, and what we cannot say
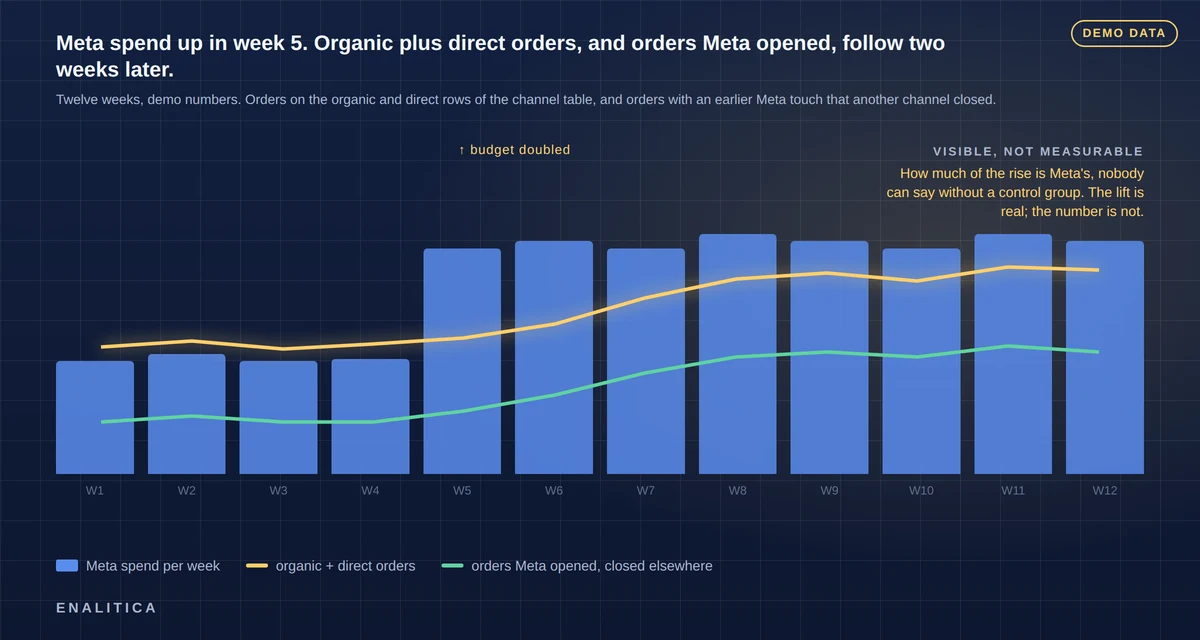
Across the stores we measure, the pattern repeats whenever Meta spend rises meaningfully for more than a couple of weeks: the organic and direct rows in the channel table grow, orders on those rows arrive a few days behind the spend, and more of them carry an earlier Meta touch that another channel closed. When Meta is cut hard, the same rows sag a few weeks later. We can see it in the daily figures, next to the Meta spend, in the same table.
What we cannot say is how much of it is Meta's. A store is not a laboratory. In the same weeks the store also sent a newsletter, a magazine ran a photo, prices changed, the season turned, a competitor went quiet. Nobody can subtract those from the organic line without a control group, and a store with one country and one shop has no control group. Anyone who hands you a percentage for the halo in your store is modeling it, and modeling is exactly what modeled conversions do: produce a confident number nobody can audit.
So we do two things instead. We show the lift where it is visible, in your own numbers, next to the spend that may have caused it. And we say in every report where Meta looks weak: read the Meta row as a floor, not a verdict.
How to read the Meta row: a floor, not a verdict
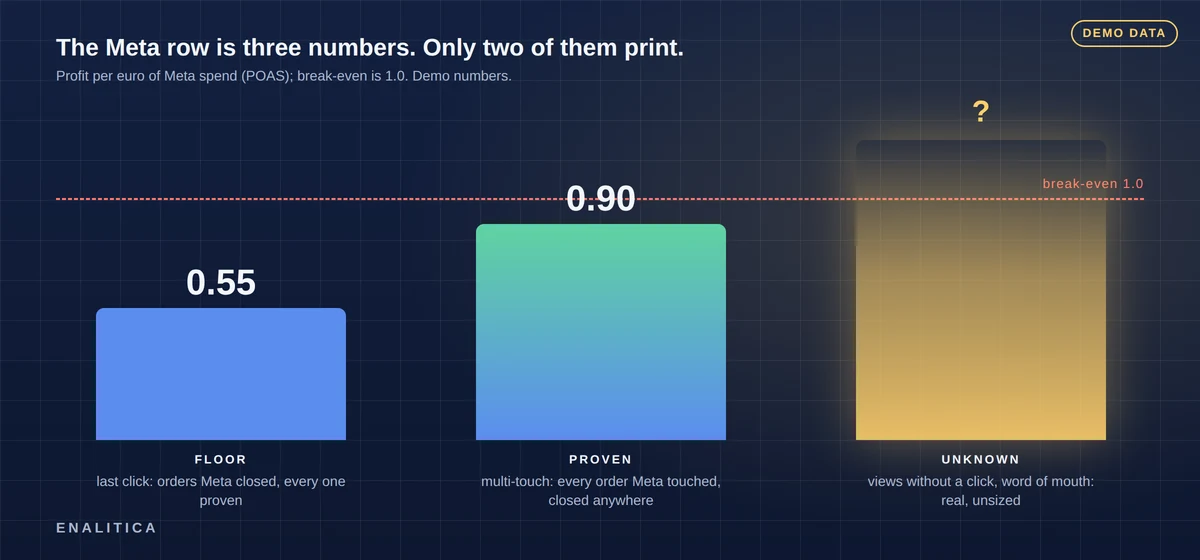
The Meta row in an order-based report is three numbers stacked on top of each other, and only the bottom two are printed.
- Last-click profit per euro (POAS), the floor. Every order counted here has a proven Meta click as its last touch. Nothing in it is estimated. If this number alone is above break-even 1.0, Meta earns its budget before any halo, and the halo is a bonus you do not need to argue about.
- Multi-touch profit per euro, the proven ceiling. Every order Meta provably touched anywhere on the journey, including the ones Google brand search or organic closed. This is the measurable part of the halo. A Meta channel weak on last click but healthy here is doing its job as an opener; cutting it on the first number is the classic mistake, and the assisted conversions guide walks through it.
- The unmeasurable part, above both. Views without clicks, word of mouth, the sister's order. Real, invisible, unsized.
The decision rules that follow are short.
- Above break-even on last click: keep or raise by the normal budget rules. The halo is on top.
- Below on last click, above on multi-touch: Meta is opening journeys others close. Fix the creative and the audiences before touching the budget, and never judge it on last click alone.
- Below on both: you may still be losing a halo you cannot see, so do not cut in one step. Step the budget down by about 30 percent, hold four weeks, and watch three lines: brand searches, organic plus direct orders, and MER. If they sag with the cut, you have found the halo the hard way and you restore. If nothing moves, the cut was right and you take the next step.
- Never pause the whole account as a "test" in the weeks before your season. The halo you lose costs more than the answer is worth, and the pause guide explains how to run a pause as an experiment when the timing is right.
Five signals of the halo in your own numbers
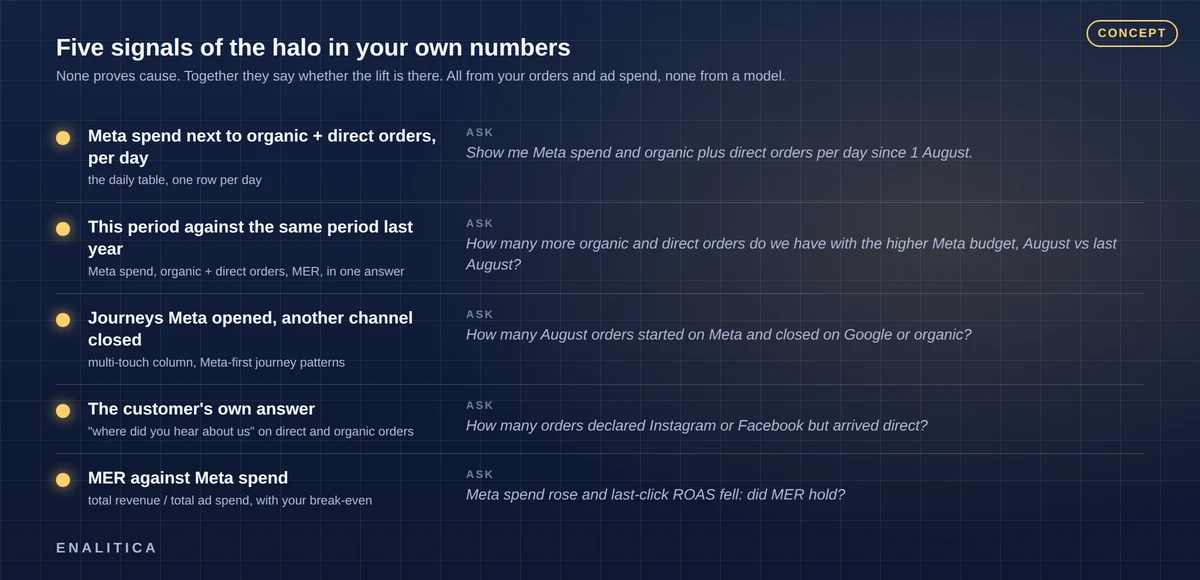
None of these proves cause. Together they tell you whether the lift is there, and they are all read from your orders and your ad spend, not from a model. Each one is a question you can ask in plain words when your assistant is connected to Enalitica through MCP.
- Meta spend next to organic and direct orders, day by day. The daily table carries ad spend per platform and orders per acquisition channel on the same row, so a budget step on Meta and the organic and direct rows two weeks later sit in one view. Ask: "Show me Meta spend and organic plus direct orders per day since 1 August."
- This period against the same period last year, in one answer. Meta spend, other paid spend, organic and direct orders and revenue, orders Meta opened that another channel closed, and MER, for the window you name and the same window a year earlier (or the one just before), each with the change. The answer says whether organic and direct moved with the Meta spend, names what else moved in the same weeks, and refuses to put a percentage on the cause. Ask: "How many more organic and direct orders do we have with the higher Meta budget, August this year against August last year?"
- Journeys Meta opened that another channel closed. The multi-touch column on the Meta row, and the journey patterns for orders whose first touch was Meta: how many, how many days to the order, which channel closed them. Ask: "How many August orders started on Meta and closed on Google or organic, and how long did they take?"
- The customer's own word. Where the checkout asks "where did you hear about us", orders that arrived direct or organic but declare Facebook or Instagram are the halo saying its name. Self-reported attribution never overrides a click, and it is the only method that sees the view without one.
- MER against Meta spend. Total revenue divided by total ad spend, with your own break-even line. If Meta spend rises, last-click Meta ROAS falls and MER holds or improves, the money came back through other doors. The blended ROAS guide explains why this is the number the owner should read first.
Read the five together, not one at a time. Brand searches up while spend went up and MER held is a pattern; brand searches up alone is a Tuesday.
When you want a real number
There are three ways to get closer to a number, in rising order of cost, and each has a floor below which it does not work.
- The step-down experiment, described above: cut 30 percent, hold four weeks, read the three lines. It is free, it is slow, and it gives a direction rather than a percentage. It is the right tool for a store spending a few thousand euros a month on Meta.
- Meta's own lift tests (Conversion Lift, Search Lift through a measurement partner). They need a big enough audience for the withheld group to be statistically readable, which in practice means tens of thousands of euros of spend per test. Below that, the confidence interval is wider than the effect. The incrementality guide covers what these tests can and cannot prove.
- A geo split for stores that sell in several countries or regions: run Meta in one, hold it in a comparable one, compare organic and direct over six weeks. Honest when the regions are alike, rarely alike enough.
Marketing mix models promise the same answer from history alone. For a store below roughly fifty thousand euros of monthly spend they fit noise, and they cannot be audited against an order. We will write about them separately; for now, the step-down and the five signals are the honest toolkit.
Frequently Asked Questions
Does Meta advertising increase organic traffic?
In every published lift test, yes: people exposed to Meta ads made 19 percent more search visits to the advertiser's site across Brainlabs' 17 tests, most of them through organic search, and awareness campaigns lifted branded search by 22 percent in Nest Commerce's tests. What no test tells you is the size of the lift in your store. Read your own brand searches and organic plus direct orders next to your Meta spend, and treat the studies as proof that the effect exists, not as a rate.
How long after a Meta campaign do brand searches rise?
Days, not minutes, and it fades over weeks. Journeys that start on Meta and close on Google or organic typically take several days from first touch to order; your own journey patterns show the average for your store. When you change the Meta budget, hold at least three or four weeks before reading organic and direct, and ignore the first week entirely.
Should I cut Meta if its last-click ROAS is below break-even?
Not in one step. Check the multi-touch figure first: if Meta is above break-even there, it is opening journeys other channels close, and the fix is creative and audience, not budget. If it is below on both, step down 30 percent, hold four weeks, and watch brand searches, organic plus direct orders and MER. If they sag, restore; if not, take the next step.
Why does Meta report more sales than my orders show?
Because Meta counts view-through conversions, models what its pixel cannot see, and claims orders another channel closed. Order-based reporting counts an order once, on the proven click. The full comparison is in how Meta, Google and Enalitica count conversions. The halo is the honest part of the gap; the rest is double counting.
Does the halo also come from YouTube, TikTok and display?
Yes. Any channel that reaches people who are not searching produces the same pattern: few clicks, orders arriving later through brand search, organic and direct. The same floor rule applies: last click is the lower bound, multi-touch the proven part, and anything above it is real but unsized. The view-through guide explains why the platforms' own numbers for these channels are the upper bound.
How do I check the Meta halo in Enalitica?
Five places, all in your own data: the daily table with Meta spend next to organic and direct orders; the period comparison that puts Meta spend, organic and direct orders and MER for this window against the same window last year; the multi-touch column and the journey patterns for Meta-first orders; the declared source on orders; and MER against spend on the summary page. Connected through MCP, your assistant reads all five, and the honest answer it gives is the same one this article gives: the lift is visible, its size is not.
See your real numbers
Import 30 days of orders or leads during a 5-minute onboarding. Works for e-commerce and service businesses.
See plans and pricing