Marketing Mix Modeling for Online Stores: Do You Need It?
Marketing mix modeling needs years of weekly data and budgets that move for their own reasons. A check you can run, our store data, and what to do instead.
 Tilen Ledic Written by
On this page
- What Is Marketing Mix Modeling (MMM)?
- How Much Data Does an MMM Need?
- Why Ad Spend Has to Move for Its Own Reasons
- Does Ad Spend Drive Sales, or Do Sales Drive Spend?
- MMM vs Attribution vs Incrementality Testing
- When Does an MMM Make Sense for a Store?
- What Can a Smaller Store Do Instead of an MMM?
- Why Enalitica Has No Marketing Mix Model
The demo ends on the slide you expected. Your attribution is biased, the vendor says, and serious brands have moved to marketing mix modeling. You sell in one country, you run Google and Meta, and you are now wondering whether you are about to pay for a model your store cannot feed.
Marketing mix modeling works, and for a large advertiser with TV, radio and several markets it answers questions nothing else can. Most online stores have a different problem: too few weeks of history and budgets that rise and fall with their own sales. You can test your store in two minutes further down, using the same arithmetic Google publishes.
What Is Marketing Mix Modeling (MMM)?
Marketing mix modeling (MMM) is a statistical method that estimates how much of your sales each channel caused, using weekly totals of spend and revenue. Meta's Robyn guide puts it plainly: MMM "does not need user level data". No clicks, no cookies, no journeys.
You will also see it called media mix modeling. The method is the same, and the name mostly tells you whether the model looks only at ads or also at price and promotions.
An MMM adds three ideas that a simple report lacks:
| MMM term | What it means in store language | Why the model needs it |
|---|---|---|
| Baseline | The sales you would have without any ads | Separates ad effect from your brand and season |
| Adstock | An ad keeps working for a while after it ran, then fades | A Monday ad can sell on Friday |
| Saturation | Each extra euro buys a little less than the one before | Doubling a budget rarely doubles the sales |
The software itself costs nothing. Google's Meridian "is free for anyone to use" and Meta's Robyn is MIT licensed. What you pay for is the data, and someone who can read a model that returns ranges where you were hoping for a number.
How Much Data Does an MMM Need?
Google and Meta set the floor themselves. Meridian's documentation asks for at least two years of weekly data for a regional model and three years for a national one. Robyn's guide asks for at least two years, and about 10 observations for each variable you add.
Years alone do not settle it, because each thing the model estimates uses up some of those weeks. Google's worked example takes 12 channels, six controls and eight knots (points that let the baseline bend over time).
That makes 26 parameters on 104 weeks, or four data points each, and Google's verdict is that this "is too low to estimate the model reliably".
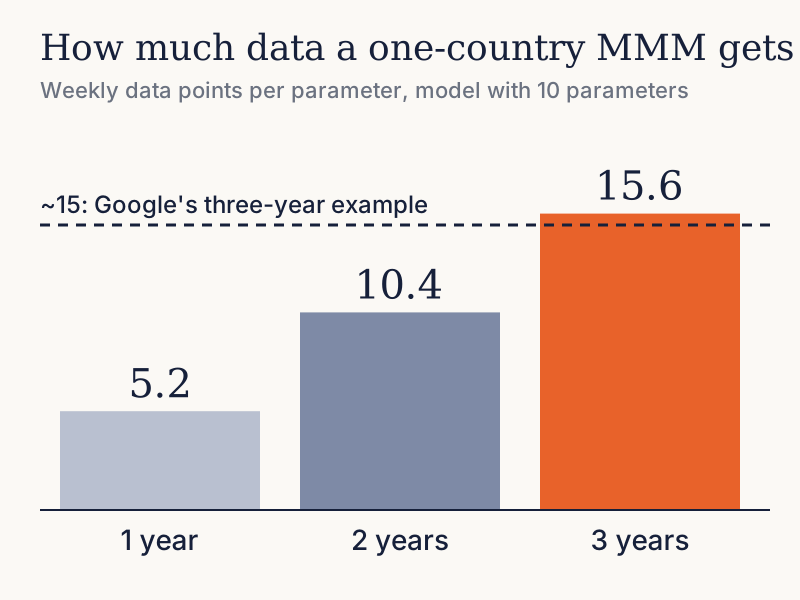
Google's fix for a one-country model is to shrink it to 10 parameters over three years, which gives roughly 15 data points per parameter. For a store, a modest model of three channels, three controls and four knots lands on the same 10 parameters. Put your own store into the same sum:
Does your store have enough data for an MMM?
For a one-country model. Enter what you have and get the same sum Google publishes for Meridian. Nothing leaves your browser.
Advanced: the seasonal curve (knots)
Sum: parameters = channels + other drivers + knots; points = weeks / parameters. The marks come from Google's examples and guarantee nothing.
A one-country store with two years of weekly data and a modest model gets about 10 data points per parameter, roughly two thirds of what Google's own three-year example reaches.
Selling in several countries helps, because Meridian's regional model lets markets borrow strength from each other. Google is also clear that the true figure then sits somewhere between a strict and a lenient count, and the worked example behind that range uses 105 regions, far from the three or four markets of a growing store.
Why Ad Spend Has to Move for Its Own Reasons
An MMM learns only from weeks in which something changed. Google notes that "insufficient variation in the media spend adversely impacts national models", and Robyn's guide gives the extreme case: sales move every week, TV spend stays flat, so the model has nothing to compare.
We checked how store budgets really behave. In Enalitica's data for the 52 weeks to 1 November 2026, at the median store:
- Google Ads spend is steady. It changes by more than 20% from the week before in about 1 week out of 5.
- Meta spend moves a lot. The same jump happens in almost half of all weeks (45%).
- The two channels mostly move apart. Their weekly spend has a correlation of 0.24, with stores ranging from slightly negative to 0.91.
That last line is good news for a model at the typical store, and worth saying plainly. Multicollinearity (the word Robyn's guide uses for two inputs that move together so tightly that the model cannot tell them apart) is a real problem only for some stores, and your own number decides which group you are in.
The catch is why the budget moved. A budget raised because you decided to test something teaches the model a lot, while a budget raised because sales were already strong teaches it almost nothing.
Does Ad Spend Drive Sales, or Do Sales Drive Spend?
Store budgets tend to follow sales, and that is the weakness of a model built on totals. Among stores in Enalitica's data, Meta spend had a correlation of 0.61 with revenue in the same week. Google Ads came in far lower at 0.26, which fits a budget that mostly stays where it was set.
Shift the comparison by one week and the Meta result becomes the interesting one, since it comes out the same in both directions:
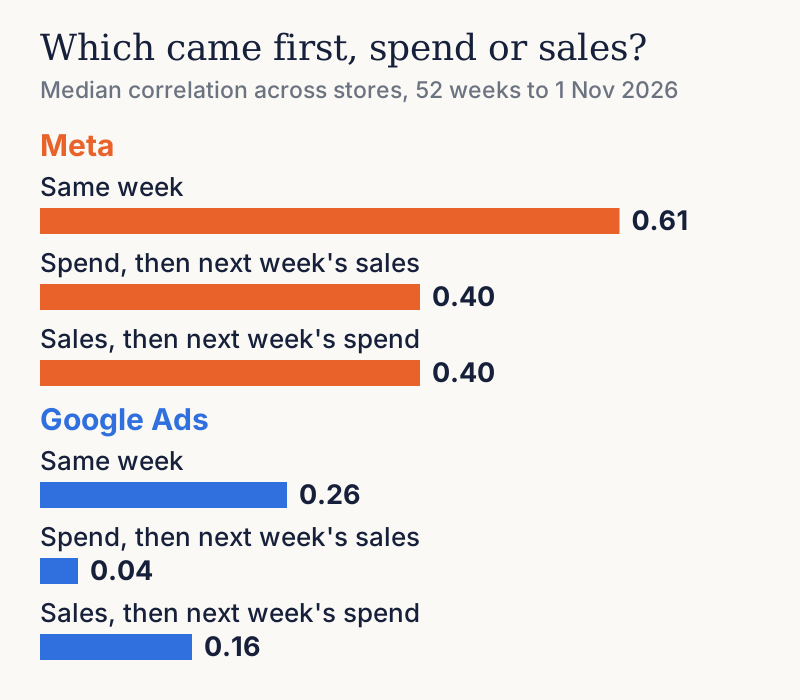
At the median store, Meta spend lines up with next week's sales exactly as closely as sales line up with next week's Meta spend. Totals alone cannot tell you which one came first.
Black Friday shows the same trap on one page. Against each store's October 2025 average, revenue in the Black Friday week reached 4.4 times normal at the median store, while Meta spend reached 1.8 times and Google Ads 1.2 times.
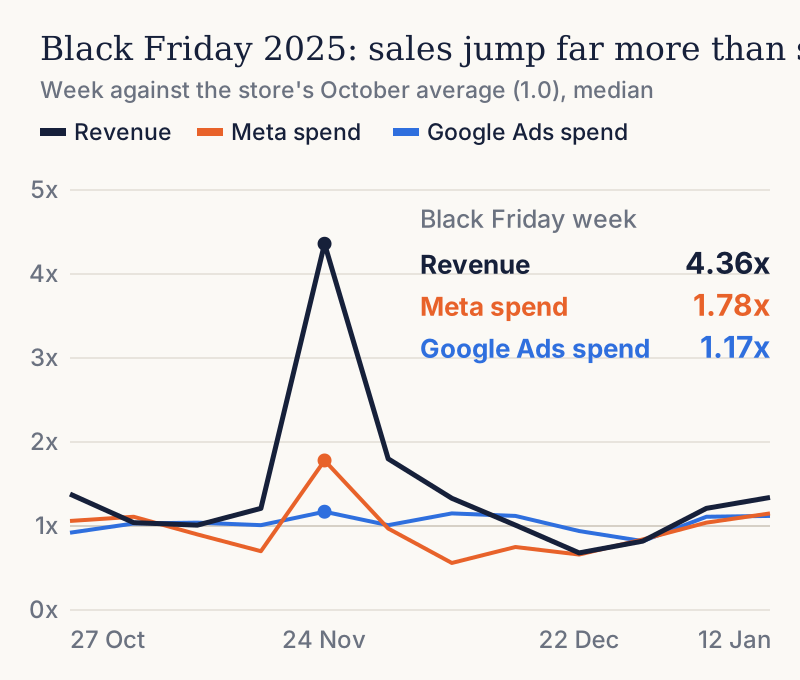
An honest model has to split that peak between ads, discounts and a shopping day that would have brought people anyway.
Give it a control for the promotion and it spends one more parameter of your scarce data. Leave the control out and it hands the credit to the ads. We looked at what these weeks should change in your setup in the Black Friday tracking checklist.
The professional answer is calibration: you feed the model results from real experiments. Robyn's guide calls experiments "the ground truth" and strongly recommends them, and Meridian's calibration page says "there is no single formula" for turning one into the model's starting belief.
So a sound MMM depends on experiments you have already run, which brings us to the order of work.
MMM vs Attribution vs Incrementality Testing
Each of the three methods answers a different question, so the useful comparison is by the question you have on Monday morning. An MMM sizes channels over quarters, an incrementality test proves one change caused sales, and order-level attribution shows who bought after which click.
| Order-level attribution | Incrementality test | Marketing mix model | |
|---|---|---|---|
| Your question | Which campaign and keyword sold this order? | Did this channel cause sales I would not have had? | How should next year's budget split across channels? |
| What it needs | A click ID saved on each order | A control group or a comparable region | Two to three years of weekly totals |
| First answer in | Days | About 4 to 6 weeks per test | Months |
| Sees TV, radio, billboards | ✗ | ✓ | ✓ |
| Works on one campaign | ✓ | ✓ | ✗ |
| You can check it against an order | ✓ | ✗ | ✗ |
| Fits a store with one market and two channels | ✓ | ✓ | ✗ |
The multi-touch attribution guide covers the first column and the incrementality guide the second. Google's own Conversion Lift "isn't available for all Google Ads accounts", so at a smaller budget the test is usually one you design yourself.
When Does an MMM Make Sense for a Store?
An MMM earns its place when a large part of your budget goes to channels that leave no click and you have the history to study them. We could not find a spend threshold in either Google's or Meta's documentation, so treat any figure you hear as somebody's opinion. Answer these four questions in order instead:
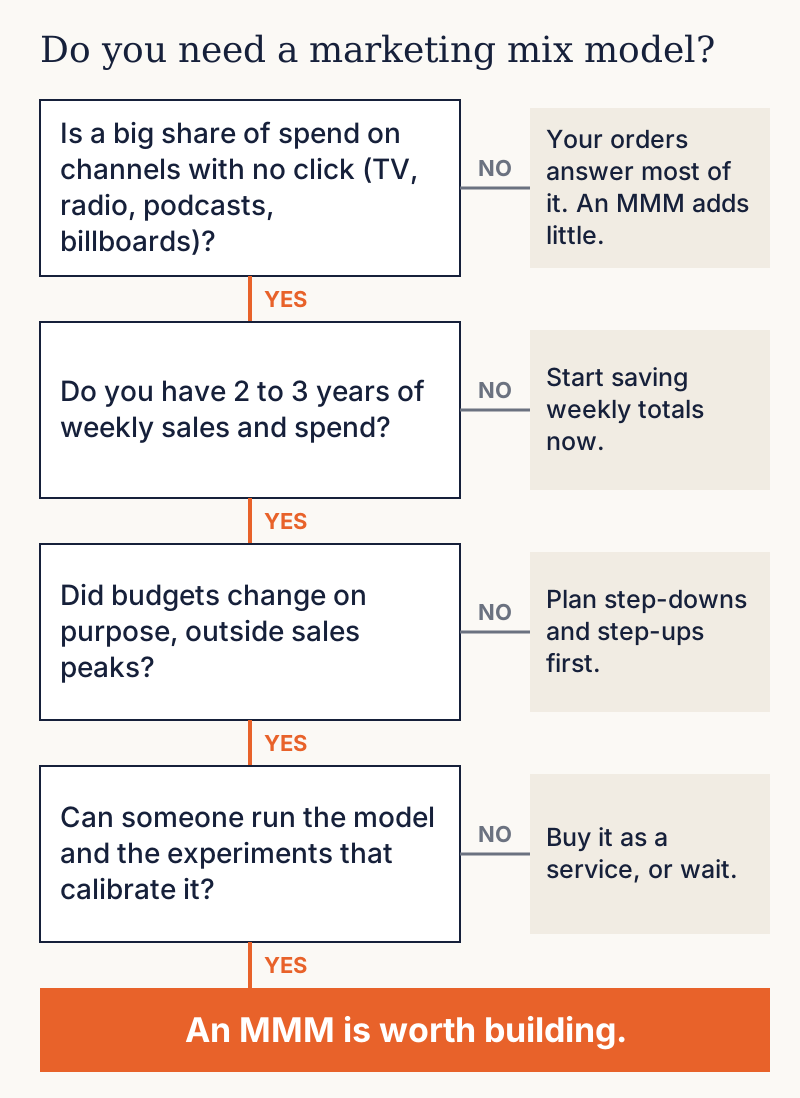
Our own working line, which is an opinion and not a published rule, is roughly $100,000 a month in ad spend. We explain the reasoning in the Northbeam alternatives comparison, and below it the cross-channel question is mostly ads against organic, email and direct, which a stored journey on every order answers without any model.
What Can a Smaller Store Do Instead of an MMM?
A smaller store gets further with its orders and a few planned budget changes, and the same steps build the history an MMM would need later:
- Save the click on every order. A journey stored with each order tells you what sold, and you can check any figure against a real order.
- Keep weekly totals from today. Spend per channel, revenue and new customers, in one sheet or one tool. Time is the one input you cannot buy later.
- Write down why budgets changed. A planned test, a sale, a stock problem. A model, or you in a year, will need that note.
- Change budgets on purpose. Cut one channel by 30% for four weeks and read what moved, using the step-down test in our halo guide.
- Test by region if you sell in two markets. Run a channel in one and hold it in a comparable one.
Planned budget changes are worth more than any model you can buy today, because they give you a direction now and give a future MMM the variation it will need.
Why Enalitica Has No Marketing Mix Model
Enalitica has no marketing mix model and runs no incrementality tests, and I would rather say that here than have you find it in a contract.
I ran a store for 15 years and what I needed on Monday was a number I could check against an order, so Enalitica starts from the order and saves the click ID on it.
That choice has a clear limit. If most of your budget sits on TV, radio or podcasts, no click reaches the order and you need a model next to us or instead of us, and the Triple Whale alternatives comparison lists tools that offer one.
For the store with Google, Meta and email in one or a few markets, Enalitica shows what the platform claims next to what your orders show, per campaign. Enalitica also keeps daily spend next to orders from the day you connect, so the weekly history starts building by itself.
Book a demo and we will look at your own budget changes and what your orders say about them.
Frequently Asked Questions
Can marketing mix modeling work with one year of data?
It can run, but both Google and Meta ask for at least two years, and a year gives you one Black Friday to learn from. Some vendors advertise shorter floors by leaning on prior assumptions. Then ask how much of the answer comes from your data and how much from those assumptions.
Does MMM replace a cookie banner or consent?
MMM itself runs on totals, so it needs no consent from the people in them. It does not change what your pixels and tags need, and those still fall under your banner. For the wider picture read privacy-safe attribution, and check your own setup with your lawyer.
How often should a marketing mix model be refreshed?
Robyn's guide describes refreshing as often as monthly or weekly once a model exists, and suggests rebuilding when most of the data is new. A refresh is cheap compared with the first build, because the slow part is collecting and cleaning the history.
Can an MMM tell me which campaign to pause?
Rarely. Every campaign you add becomes another parameter on the same few weeks of data, so most models stop at channel level. Deciding which campaign to pause needs orders per campaign and clear rules for pausing.
Which is better for a small store, Google Meridian or Meta's Robyn?
Both are free, built by companies that also sell you ads, and written for people comfortable with code and statistics. The harder question is whether your data passes the check above, and if it does not, neither tool will fix that. Because the code is open, an analyst can inspect how either one works.
Sources
The outside pages this article relies on. Links checked on 6 November 2026.
- Meta's Robyn guide (facebookexperimental.github.io)
- Google's Meridian (developers.google.com)
- Meta's Robyn (github.com)
- Meridian's documentation (developers.google.com)
- Google's worked example (developers.google.com)
- Meridian's calibration page (developers.google.com)
- Conversion Lift (support.google.com)
Figures marked "in Enalitica's data" are aggregates from the real orders of the stores we measure, with no names and no individual orders. How we measure.

See your real numbers
Import 30 days of orders or leads during a 5-minute onboarding. Works for e-commerce and service businesses.
See plans and pricing