What Is a Good ROAS? Work It Out From Your Margin
A good ROAS is one above your break-even, and your margin sets that. Table by margin, the VAT and returns check, and how far Meta's number sits from orders.
 Tilen Ledic Written by
On this page
Your agency sends the monthly report: ROAS 3.2, up from 2.9, well done everyone. You look at the bank account and it does not feel like 3.2. Someone on a forum says 4x is the goal, someone else says 2x is fine, and neither of them knows what you pay for your goods.
A good ROAS (return on ad spend, the money that comes back for every euro in ads) is one that sits above your break-even, and your margin sets the break-even. At a 50% margin, 2x pays for itself. At a 25% margin, 2x loses money on every order. So the same number can be a good month in one store and a slow leak in the next.
How do you work out a good ROAS for your store?
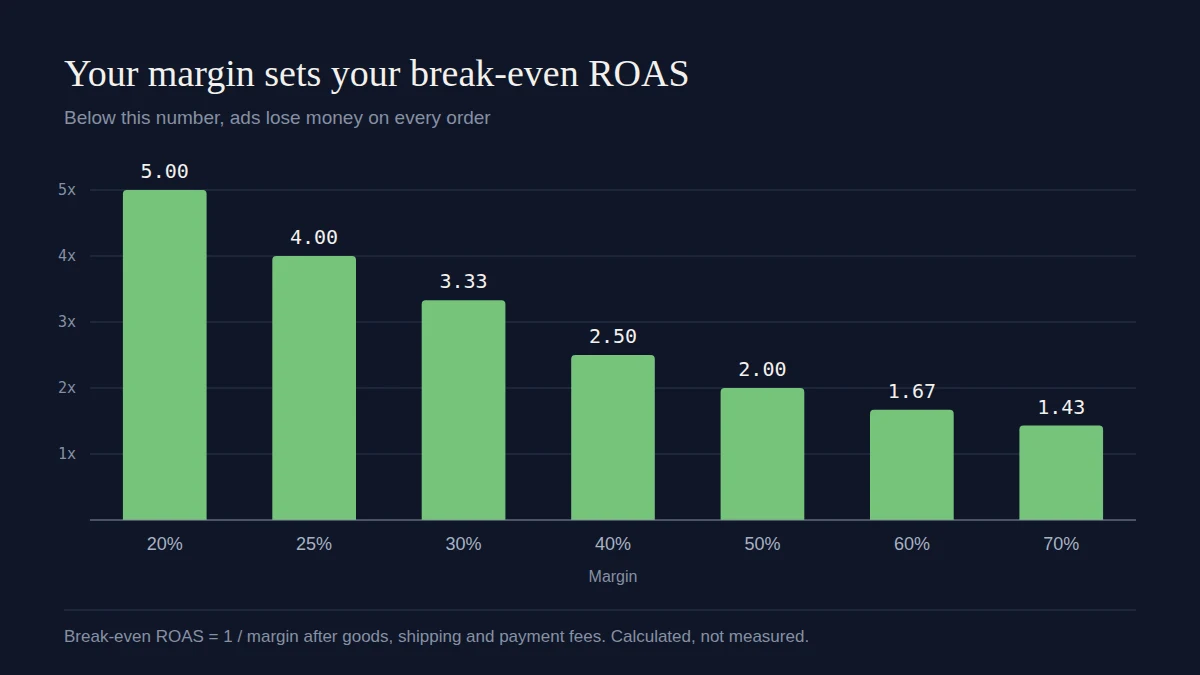
Take your margin after the cost of goods, shipping and payment fees, then divide 1 by it. That is your break-even ROAS. To leave room for overheads and profit, multiply it by about 1.4. The buffer is a working habit of ours, so change it if your overheads are unusually high or low.
| Margin | Break-even ROAS | Target ROAS (× 1.4) | Target as Google Ads shows it |
|---|---|---|---|
| 20% | 5.00 | 7.00 | 700% |
| 25% | 4.00 | 5.60 | 560% |
| 30% | 3.33 | 4.67 | 467% |
| 40% | 2.50 | 3.50 | 350% |
| 50% | 2.00 | 2.80 | 280% |
| 60% | 1.67 | 2.33 | 233% |
| 70% | 1.43 | 2.00 | 200% |
The last column is there because the two ways of writing ROAS confuse people. Google states target ROAS as a percentage: 5 in sales for 1 in spend is 500%, which is the same thing as 5x.
Why is the ROAS on your screen higher than the one you earn?
Compare your break-even only with a ROAS in the same terms. The number in the ad platform often is not. Run these two checks first (figures illustrative):
- VAT. Margin is calculated without VAT. If your store sends order values with VAT to the platform, divide by 1 plus the rate. At 20% VAT, a reported 3.0 is 2.5.
- Returns. Most platforms keep counting an order you later refunded unless you send them a correction. If 10% of the value comes back, 2.5 becomes 2.25.
Now take a store on a 40% margin. Break-even is 2.5. The dashboard says 3.0 and the report calls it healthy. After VAT and returns the real figure is 2.25, under break-even, and each extra euro of ads makes the month worse. We covered what returns do to these decisions in POAS vs ROAS.
Is the ROAS in Google Ads and Meta the real number?
It is the platform's own count, and the gap to your orders differs a lot by channel. We compared each store's reported ROAS with the ROAS from the orders that actually carry that platform's click ID.
In Enalitica's data for the 90 days to 4 November 2026, Meta's reported ROAS was 3 times the ROAS from orders with a Meta click ID at the median store, and between 1.7 and 5.9 times across stores. Google Ads was much closer: 1.1 times at the median, between 0.8 and 1.4. We left out stores where the conversion values in the platform were clearly misconfigured.
Read that with care. Orders with a click ID are the floor for what a channel did, because someone who saw an ad and came back later through search leaves no Meta click on the order. Meta's figure is the ceiling: it depends on the attribution setting in your Ads Manager, which can include people who only viewed an ad. The truth for your store sits somewhere between the two, and the two can be far apart.
For the decision, this means a Meta ROAS of 3.0 and a Google ROAS of 3.0 are different claims. At a 40% margin the Google number probably clears break-even. The Meta number might, and you need the order view to know. How Meta, Google and order data count the same sale goes through why.
Is there a benchmark for a good ROAS?
We looked for an ecommerce ROAS benchmark from a source with no product to sell, and did not find a credible one. The published figures come from vendors and agencies and disagree with each other. The old "4:1" is a rule of thumb, and you can see from the table that it means a healthy profit at 60% margin and a loss at 20%.
If you want a sanity check for the business as a whole, Shopify's guide cites a benchmark study that puts a healthy marketing efficiency ratio at about 3 to 5. That compares all revenue with all marketing cost, so it is a different number from a campaign's ROAS, and our own data shows why it travels badly. All revenue divided by all ad spend came to 7.6x at the median store over those same 90 days, from around 3x to above 20x. The stores at the top mostly sell a lot without ads, which says little about whether their ads pay. The guide to blended ROAS and MER explains when that view helps.
When is a ROAS below break-even still fine?
Three cases, each of which needs a number behind it:
- The customer buys again. A first order at a loss can pay back on the second. Check that with cohorts from your own orders, using what a customer is really worth, since most of the "lifetime value" figures you will read are revenue and not profit.
- The campaign is still learning. Do not judge a week. Google asks for at least 15 conversions in the past 30 days before target ROAS bidding on Search and Shopping, which gives a sense of how little a handful of orders can prove.
- You are clearing stock. Selling goods you would otherwise write off changes the margin in the formula. Use the real one for that campaign.
The opposite case matters as much. A campaign on your own brand name can show 15x and earn almost nothing, because many of those people were already on their way to you. See bidding on your own brand name before you count it as your best campaign.
How Enalitica shows this per campaign
I ran a store for 15 years and the question I could never answer on Monday morning was which of these numbers to believe. So Enalitica starts from the order. The click ID is saved on the order itself, then matched to the campaign and the keyword behind it. Next to each campaign you see what the platform claims and what your orders show, on the same period and in the same view.
Add your cost of goods and the report moves from revenue to profit: POAS has a break-even of exactly 1.0 for every store, whatever the margin, because the margin is already inside it. You can book a demo and we will go through your own campaigns against your margin.
Frequently Asked Questions
Is a 4x ROAS good?
At a 40% margin, yes: it is above the 3.5 target. At 25%, you are near break-even, and at 20% you lose money on every order before overheads.
Should Google Ads and Meta have different ROAS targets?
The break-even is the same, because it comes from your margin. What differs is the number you compare with it. Use the order view for both, and do not expect Meta's own report to be a like-for-like with Google's.
What ROAS should I enter as a target in Google Ads?
Start near what the campaign already delivers, then move in steps toward your target. Google warns that a target set too high may limit your traffic. Remember Google expects a percentage, so 3.5x is 350%, and a target only makes sense if the conversion values you send exclude what the margin formula excludes.
Do I need to calculate this per product?
If your margins differ widely, yes. A store selling furniture at 45% and accessories at 25% has break-evens of 2.2 and 4.0, and one average hides both. Campaigns that sell mostly one category should be judged on that category's margin.
Sources
The outside pages this article relies on. Links checked on 5 November 2026.
- states target ROAS as a percentage (support.google.com)
- Shopify's guide (shopify.com)
- at least 15 conversions in the past 30 days (support.google.com)
Figures marked "in Enalitica's data" are aggregates from the real orders of the stores we measure, with no names and no individual orders. How we measure.

See your real numbers
Import 30 days of orders or leads during a 5-minute onboarding. Works for e-commerce and service businesses.
See plans and pricing